- Silver price holds ground near its three-month high of $32.56, recorded on February 5.
- A break above the 70 RSI level could indicate overbought conditions, potentially triggering a downward correction.
- The critical support zone appears at a nine-day EMA at $31.58, followed by the ascending channel’s lower boundary at $31.00.
Silver price (XAG/USD) extends its winning streak for the fourth consecutive session, trading near $32.30 per troy ounce during Asian hours on Thursday. Technical analysis on the daily chart highlights a strong bullish bias, with the price maintaining an upward trajectory within an ascending channel.
The XAG/USD pair remains above both the nine-day and 14-day Exponential Moving Averages (EMAs), indicating solid short-term momentum. Additionally, the 14-day Relative Strength Index (RSI) is approaching the 70 level, reinforcing bullish sentiment. A break above the 70 mark could signal overbought conditions, potentially leading to a downward correction.
On the upside, Silver price faces immediate resistance at its three-month high of $32.56, last reached on February 5. A decisive breakout above this level could pave the way for a test of the ascending channel’s upper boundary at $33.10.
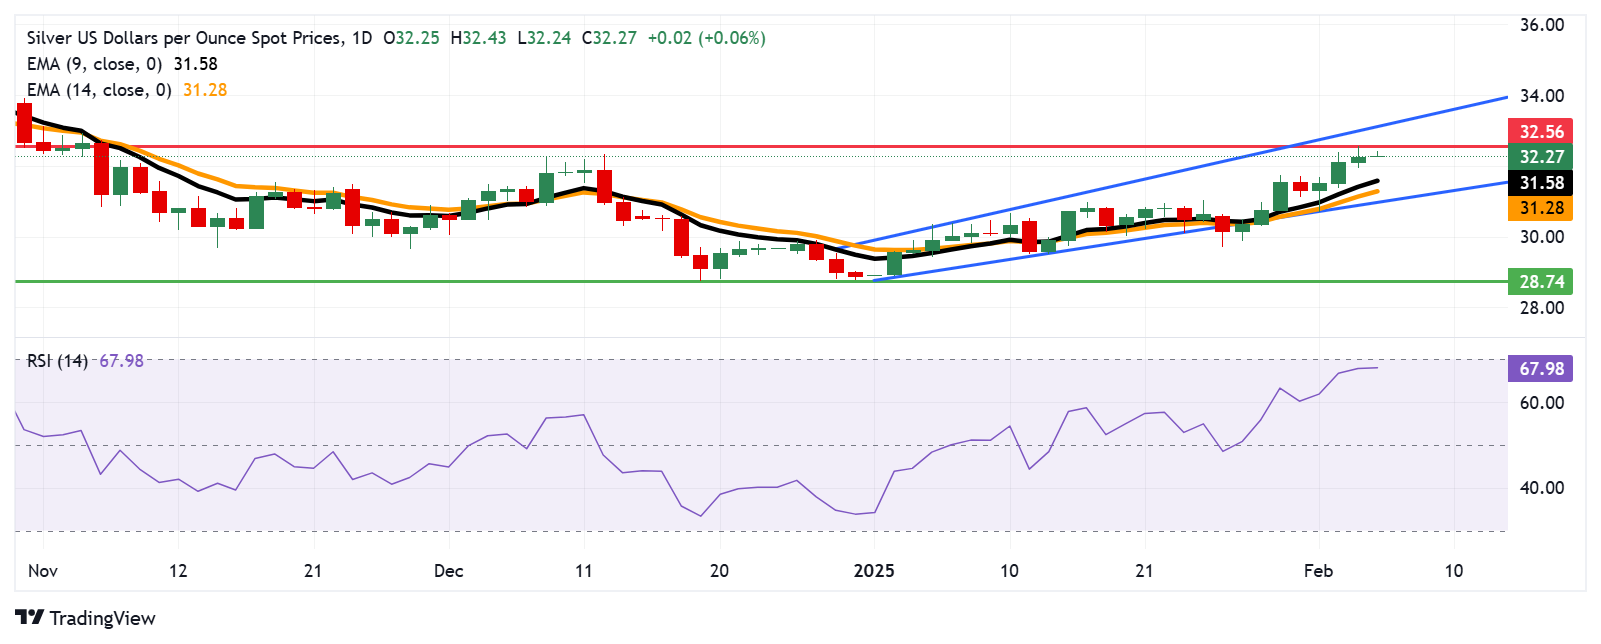
Support levels include the nine-day EMA at $31.58, followed by the 14-day EMA at $31.28, and the lower boundary of the ascending channel at $31.00. A drop below this critical support zone could weaken the bullish outlook, exposing the XAG/USD pair to further downside toward its five-month low of $28.74, recorded on December 19.
XAG/USD: Daily Chart