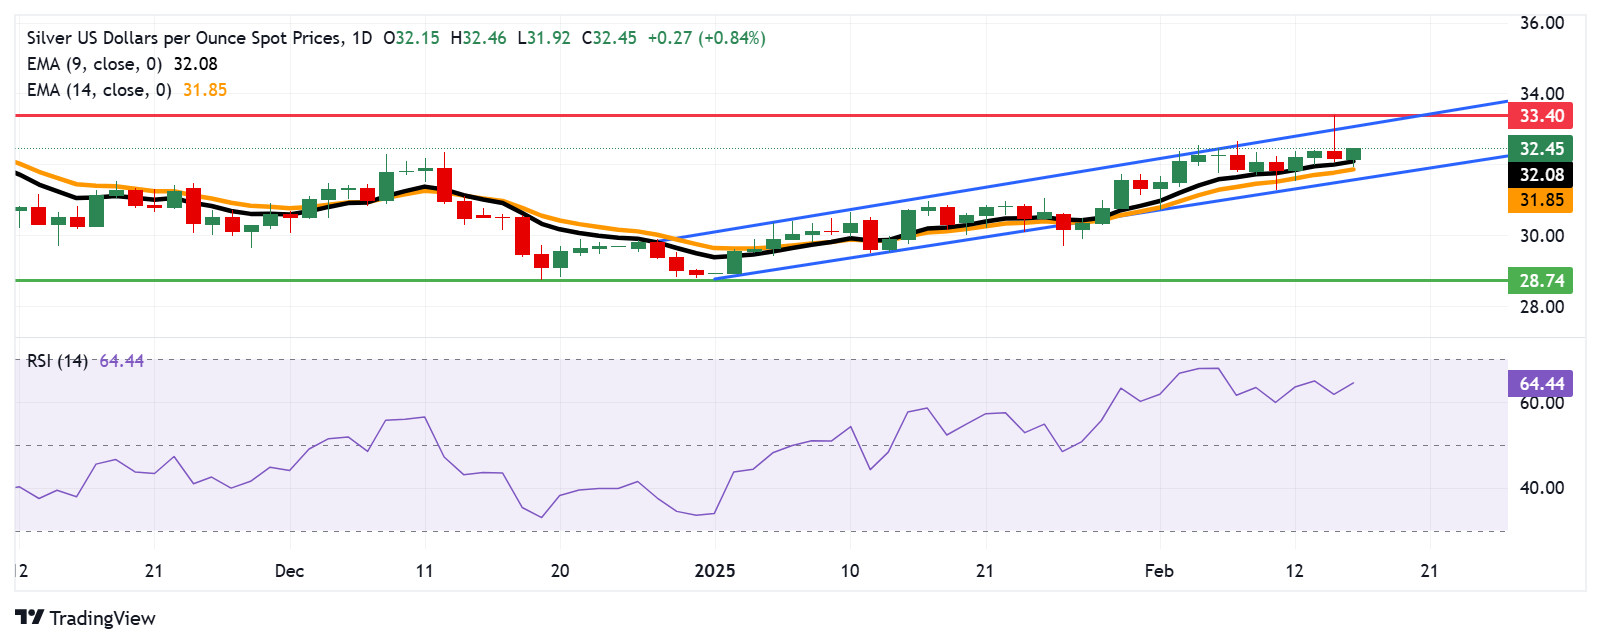
- Silver price gains ground as the daily chart analysis suggests a persistent bullish bias.
- The pair may find its primary resistance around the upper boundary of the ascending channel at the $33.10 level.
- The initial support appears at the nine-day EMA of $32.08.
Silver price (XAG/USD) recovers its recent losses registered in the previous session, trading near $32.40 per troy ounce during Monday’s Asian session. A daily chart analysis suggests a continued bullish trend, as the metal price moves upward within an ascending channel.
The XAG/USD pair continues to trade above the nine-day and 14-day Exponential Moving Averages (EMAs), indicating robust short-term momentum. Moreover, the 14-day Relative Strength Index (RSI) remains above the 50 level, reinforcing the overall bullish outlook.
Silver price may face initial resistance near the upper boundary of the ascending channel at the $33.10 level, followed by the four-month high of $33.40, which was reached on February 14.
On the downside, support is located at the nine-day EMA around $32.08, followed by the 14-day EMA at $31.85, and the lower boundary of the ascending channel at $31.60. A break below this critical support zone could undermine the bullish outlook, potentially exposing the XAG/USD pair to further declines toward its five-month low of $28.74, which was recorded on December 19.


