- USD/CAD may test the lower boundary of the rectangle at 1.4280 level.
- The short-term price momentum is weaker as the pair remains below the nine- and 14-day EMAs.
- A break above EMAs would support the pair to test the rectangle’s upper threshold at 1.4530 level.
The USD/CAD pair remains silent around 1.4310 during the Asian session on Friday. The technical analysis of the daily chart indicates that buyers and sellers are unsure of the long-term direction of the asset as the pair consolidates within a rectangular pattern.
USD/CAD remains below the nine- and 14-day Exponential Moving Averages (EMAs), reinforcing bearish sentiment and suggesting weak short-term price action. This positioning reflects sustained selling interest and hints at further downside risks.
Additionally, the 14-day Relative Strength Index (RSI) consolidates below the 50 mark, signaling continued negative momentum and strengthening the bearish outlook.
On the downside, immediate support is found at a psychological level of 1.4300, followed by the lower threshold of the rectangle at 1.4280 level. A break below this critical support zone could strengthen the bearish bias and put downward pressure on the USD/CAD pair to navigate the region around the psychological level of 1.4200.
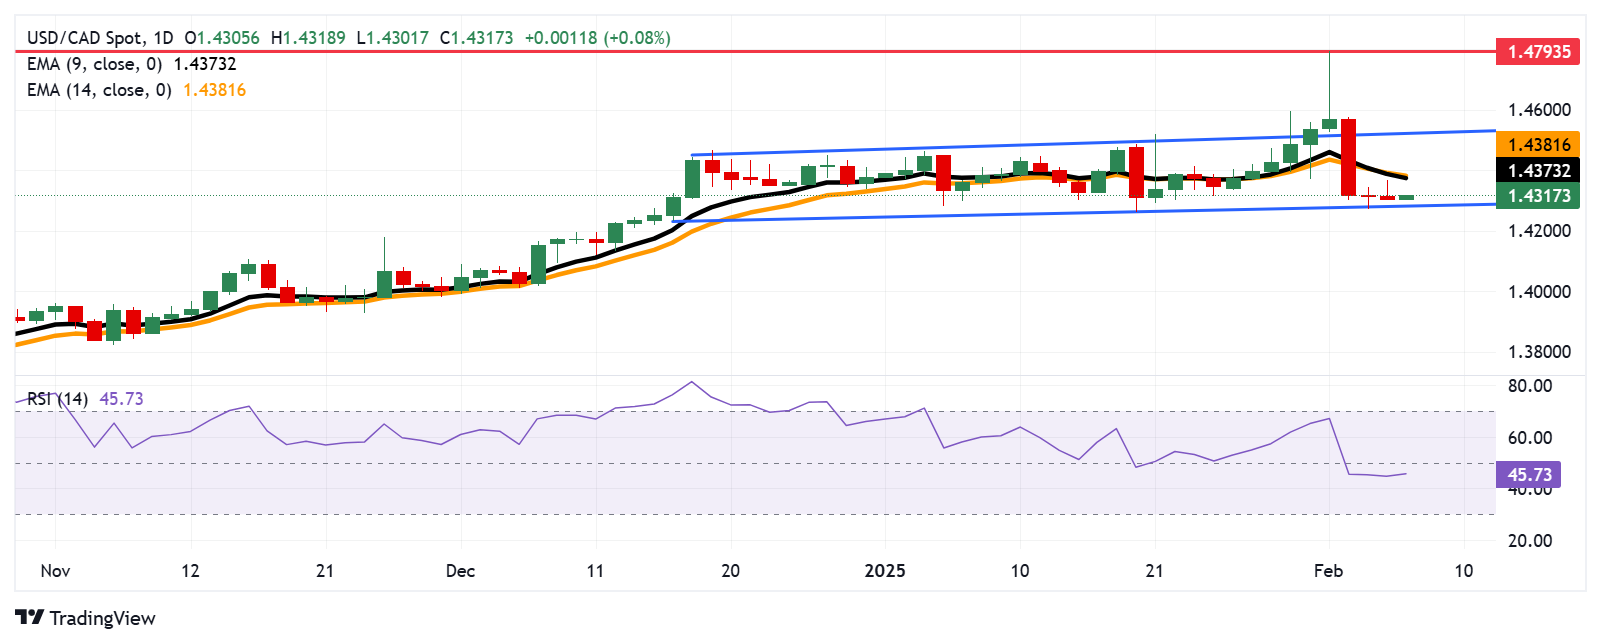
The USD/CAD pair could find its initial resistance at the nine-day EMA at 1.4372 level, followed by the 14-day EMA at 1.4381 level. A break above these levels would improve the short-term price momentum and support the pair to test the rectangle’s upper threshold at the 1.4530 level.
USD/CAD: Daily Chart