US ADP private sector employment rises 183,000 in January vs. 150,000 expected

•Employment in the US private sector rose at a stronger pace than expected in January.
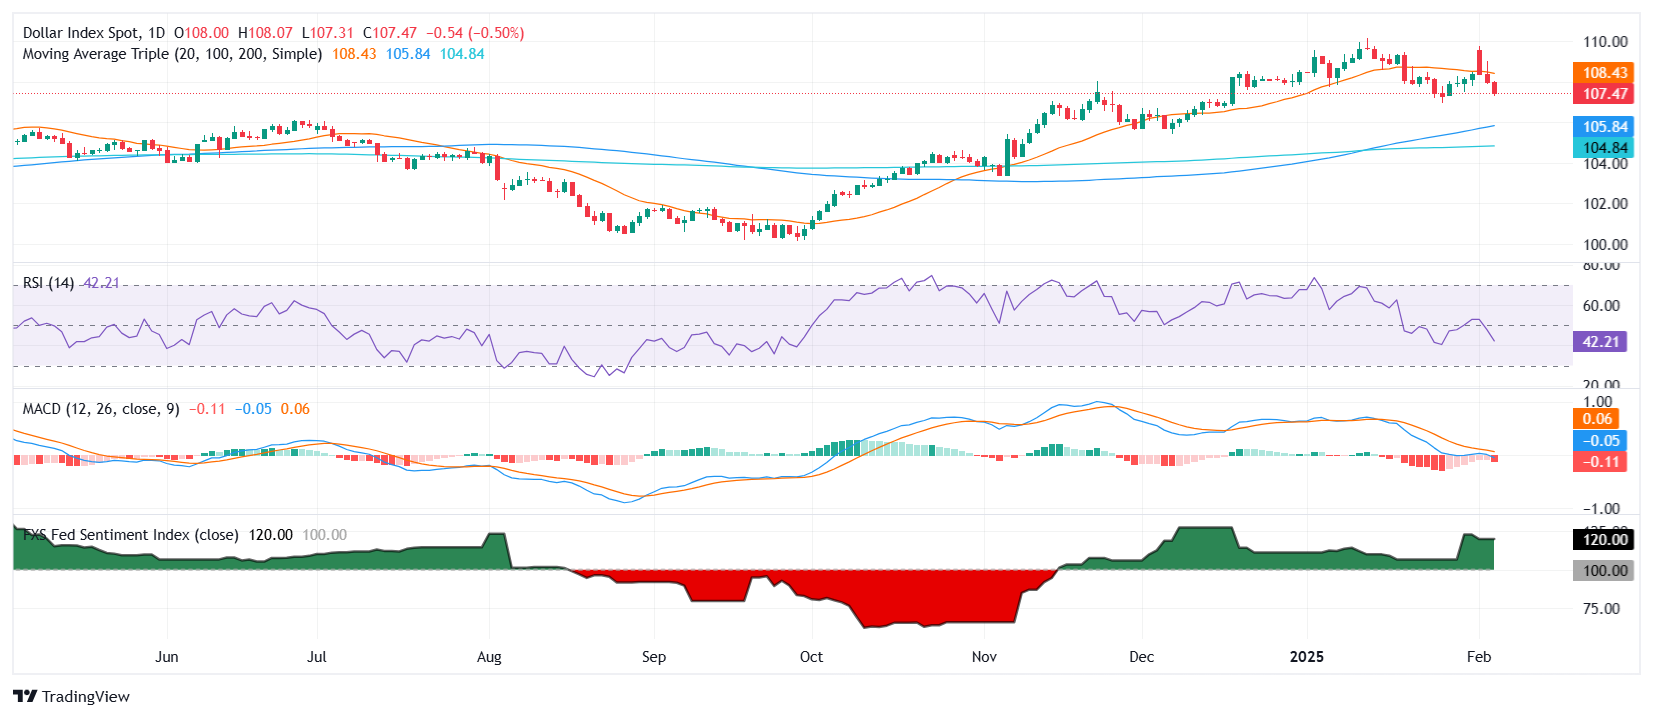
•US Dollar Index stays deep in negative territory near 107.50.

Private sector employment in the US rose 183,000 in December and annual pay was up 4.7% year-over-year, the Automatic Data Processing (ADP) reported on Wednesday. This reading followed the 176,000 (revised from 122,000) increase recorded in December and came in above the market expectation of 150,000.

Assessing the survey’s findings, “we had a strong start to 2025 but it masked a dichotomy in the labor market,” said Nela Richardson, chief economist, ADP. “Consumer-facing industries drove hiring, while job growth was weaker in business services and production.”

Market reaction

The US Dollar Indexstruggles to stage a rebound after this data and was last seen losing 0.42% on the day at 107.55.

By |2025-02-10T16:08:17+05:30February 10, 2025 4:08 pm|Forex|Comments Off on US ADP private sector employment rises 183,000 in January vs. 150,000 expected

NZD/USD Price Forecast: Posts fresh weekly high near 0.5700

  • NZD/USD refreshes weekly high near 0.5700 as receding global trade war risks have improved the safe-haven demand.
  • The USD strives to gain ground on the back of upbeat US ADP Employment data for January.
  • The NZ economy will also face the consequences of the US-China trade war.

The NZD/USD pair posts a fresh weekly high near 0.5700 in Wednesday’s North American session. The Kiwi pair gains as the US Dollar (USD) has remained under pressure due to receding risks of a global trade war.

Investors expect the trade war to remain between the United States (US) and China as the latter has imposed tariffs on a few items from the US economy in retaliation to President Donald Trump’s decision of a 10% levy on all imports from China.

The US Dollar Index (DXY), which tracks the Greenback’s value against six major currencies, refreshes weekly low to near 107.40. However, the Greenback has got some buying interest after the release of the United States (US) ADP Employment Change data, which showed that the private sector hired 183K workers in January, higher than estimates of 150K and the prior release of 176K, revised significantly higher from 122K.

US Dollar PRICE Today

The table below shows the percentage change of US Dollar (USD) against listed major currencies today. US Dollar was the strongest against the Canadian Dollar.

USD EUR GBP JPY CAD AUD NZD CHF
USD -0.21% -0.26% -0.78% -0.19% -0.28% -0.51% -0.22%
EUR 0.21% -0.05% -0.59% 0.02% -0.06% -0.29% -0.01%
GBP 0.26% 0.05% -0.56% 0.07% -0.02% -0.25% 0.04%
JPY 0.78% 0.59% 0.56% 0.61% 0.52% 0.27% 0.57%
CAD 0.19% -0.02% -0.07% -0.61% -0.08% -0.32% -0.03%
AUD 0.28% 0.06% 0.02% -0.52% 0.08% -0.23% 0.05%
NZD 0.51% 0.29% 0.25% -0.27% 0.32% 0.23% 0.29%
CHF 0.22% 0.01% -0.04% -0.57% 0.03% -0.05% -0.29%

The heat map shows percentage changes of major currencies against each other. The base currency is picked from the left column, while the quote currency is picked from the top row. For example, if you pick the US Dollar from the left column and move along the horizontal line to the Japanese Yen, the percentage change displayed in the box will represent USD (base)/JPY (quote).

Meanwhile, the outlook of the New Zealand Dollar (NZD) remains uncertain as the impact of a trade war between the US and China will also be borne by the New Zealand economy, being one of the leading trading partners of China.

On the monetary policy front, market participants expect the Reserve Bank of New Zealand (RBNZ) to continue reducing its cash rate to reduce deepening risks of inflation undershooting their target of 2%.

NZD/USD rebounds strongly from the support zone plotted around 0.5500 on a weekly timeframe. However, the outlook of the Kiwi pair is still bearish as the 20-week Exponential Moving Average (EMA) near 0.5800 is sloping downwards.

The 14-week Relative Strength Index (RSI) attempts to return inside the 40.00-60.00 range. A fresh bearish momentum would trigger if the RSI fails to do the same.

The Kiwi pair could decline to nears round-level supports of 0.5400 and 0.5300 if it breaks below the 13-year low of 0.5470.

On the flip side, a decisive break above the November 29 high of 0.5930 could drive the pair to the November 15 high of 0.5970 and the psychological resistance of 0.6000.

NZD/USD weekly chart

By |2025-02-10T16:06:43+05:30February 10, 2025 4:06 pm|Forex|Comments Off on NZD/USD Price Forecast: Posts fresh weekly high near 0.5700

EUR/USD Price Analysis: Pair extends gains above 20-day SMA, sustaining bullish momentum

  • EUR/USD climbs to 1.0420 on Wednesday, extending its upward trend.
  • The pair surges past the 20-day SMA, reinforcing a stronger short-term outlook.

The EUR/USD pair continued its bullish advance on Wednesday, rising by 0.39% to 1.0420 as buyers maintained control. With the latest price action, the pair has decisively climbed above the 20-day Simple Moving Average (SMA), a key resistance level that had previously limited upside attempts. This breakout signals a potential shift in sentiment, favoring further gains in the short term.

Momentum indicators align with the pair’s continued strength. The Relative Strength Index (RSI) has risen sharply to 53, signaling increased buying interest and a stronger bullish bias. Meanwhile, the Moving Average Convergence Divergence (MACD) histogram prints rising green bars, reflecting a sustained increase in momentum.

For EUR/USD to build on its recent gains, the next resistance levels to watch stand at 1.0450 and 1.0485. A break above these levels could open the door for a move toward 1.0520. On the downside, the 20-day SMA, now acting as support, is positioned near 1.0365, followed by a stronger support zone around 1.0350. Holding above the 20-day SMA will be key for the pair to sustain its positive trajectory.

EUR/USD daily chart

By |2025-02-10T15:55:12+05:30February 10, 2025 3:55 pm|Forex|Comments Off on EUR/USD Price Analysis: Pair extends gains above 20-day SMA, sustaining bullish momentum

US Dollar struggles as mixed data weighs on sentiment

  • DXY remains under pressure, testing 107.35 support despite upbeat ADP and S&P Global PMI data.
  • ISM Services PMI disappoints, signaling weaker than expected service sector growth and moderating price pressures.
  • US 10-year yield rebounds, hovering around 4.40% after touching a yearly low.

The US Dollar Index (DXY), which measures the USD against a basket of currencies, struggled to recover losses on Wednesday and declined against most major peers. Despite stronger than expected ADP Employment and S&P Global PMI data, the ISM Services PMI fell short of forecasts, casting doubt on the strength of the US economy.

The Fed Sentiment Index, which previously sat at 130.00, has cooled off, signaling a less hawkish tone from policymakers. As a result, traders are reassessing the Federal Reserve’s (Fed) rate path, contributing to the DXY’s weak price action around 107.35 support.

Daily digest market movers: US Dollar struggles as mixed data weighs on sentiment

  • ADP Employment Report showed that private sector employment jumped by 183,000 in January, exceeding the 150,000 forecast. Consumer-facing industries drove job creation, while manufacturing saw weaker gains.
  • S&P Global PMI data revealed that the final readings for January saw minor upward revisions with the Services PMI at 52.9 (vs. 52.8 expected) and the Composite PMI at 52.7 (vs. 52.4 prior).
  • ISM Services PMI: Disappointed at 52.8, missing the expected 54.3, while the Prices Paid index eased to 60.4 from 64.4, indicating softer inflationary pressures.
  • All eyes are now on Friday Nonfarm Payrolls for January, which is seen printing a weak result that might add more weakness to the USD.

DXY technical outlook: Bears eye 107.00 support

The DXY’s momentum indicators reflect a shift toward bearish traction. The Fed Sentiment Index cooling off from 130.00 aligns with weaker ISM data, weighing on the USD.

The Relative Strength Index (RSI) has dropped below 50, while the index has fallen beneath the 20-day Simple Moving Average (SMA) at 108.50. If downside pressure persists, the next key level to watch is the psychological support at 107.00.

By |2025-02-10T15:50:36+05:30February 10, 2025 3:50 pm|Forex|Comments Off on US Dollar struggles as mixed data weighs on sentiment

Canadian Dollar continues to drift higher on Wednesday

  • The Canadian Dollar added a thin 0.5% as the Greenback drifts lower.
  • Upbeat US employment data is sending risk appetite higher.
  • Meaningful Canadian data remains limited until Friday.

The Canadian Dollar (CAD) tested higher against the Greenback on Wednesday, chalking in a scant one-fifth of one percent gain following the early week’s sharp recovery from multi-decade lows. Us data dominated market headlines during the midweek market session, and a general improvement in trader risk appetite is stepping down on the US Dollar, giving the Loonie a leg up.

Economic data from Canada is strictly low-tier until Friday’s labor print. US Purchasing Managers Index (PMI) figures missed the market on Wednesday, but the key reading for US data came from ADP jobs change data, which showed a potential upswing in US net job gains. Traders are keeping a close eye on employment preview numbers in the run-up to Friday’s Nonfarm Payrolls (NFP) report.

Daily digest market movers: Canadian Dollar gains ground on sentiment uptick

  • The Canadian Dollar gained a few points on easing Greenback flows.
  • Canadian Trade Balance numbers for December rebounded, but less than expected. Markets overwhelmingly overlooked the data print.
  • US ISM Services PMI survey results from January softened to 52.8 from a revised 54.0, missing the forecast 54.3.
  • US ADP Employment Change swung higher to 183K, stepping over the previous revised 176K and beating the 150K forecast.
  • Canadian labor figures are due on Friday, but market attention will be fully focused on US NFP jobs figures due at the same time.

Canadian Dollar price forecast

The Canadian Dollar (CAD) managed to eke out thin gains on Wednesday, dragging USD/CAD back down to the 50-day Exponential Moving Average (EMA) near the 1.4300 handle. Loonie traders remain aware that any gains on the CAD side are coming from generalized weakness in USD flows, but gains are gains and the Loonie has recovered solidly from 21-year lows set earlier this week.

The downside of the CAD’s rebound is USD/CAD is once again back into a congestion range as the pair grinds through a volatile but immovable sideways channel. Momentum is unlikely to meaningful break through the bottom near 1.4000, and the technical ceiling remains in place near 1.4500, albeit with some new holes.

USD/CAD daily chart

By |2025-02-10T15:49:14+05:30February 10, 2025 3:49 pm|Forex|Comments Off on Canadian Dollar continues to drift higher on Wednesday

Forex Today: The BoE is expected to ease its monetary stance

The US Dollar continued its slide on Wednesday, retesting multi-day lows against its peers amid a steady unravelling of positions and lingering uncertainty over Trump’s trade policies.

Here is what you need to know on Thursday, February 6:

The US Dollar Index (DXY) dropped for the third day in a row, extending the breakdown of the 108.00 support helped by lower yields across the board and intense risk-on mood. The usual Initial Jobless Claims are due, along with Challenger Job Cuts, and advanced Unit Labor Costs. In addition, the Fed’s Jefferson, Waller, and Daly are all due to speak.

EUR/USD rose to three-day peaks and looked to consolidate the recent breakout of the 1.0400 barrier. The HCOB Construction PMI is due in the euro area and Germany, seconded by Factory Orders in Germany, and Retail Sales in the bloc. Additionally, the ECB’s Nagel is expected to speak.

Another solid day saw GBP/USD advance to three-week highs past the 1.2500 hurdle in response to further weakness hurting the US Dollar. The BoE gathering will take centre stage, seconded by the S&P Global Construction PMI and the speech by Governor Bailey.

USD/JPY weakened further and put the 200-day SMA to the test near the 152.50 zone amid extra appreciation of the Japanese yen. The weekly Foreign Bond Investment figures will be published, will the BoJ’s Tamura will also speak.

AUD/USD climbed to multi-day highs, extending its weekly rebound to the boundaries of the key 0.6300 barrier. The Balance of Trade results for the month of December will be in the spotlight Down Under.

Prices of WTI resumed their downtrend, rapidly leaving behind Tuesday’s uptick and refocusing on the key $70.00 mark per barrel amid tariffs uncertainty.

Prices of Gold rose to an all-time peak near $2,880 per ounce troy on the back of safe haven demand and further selling pressure in the Greenback. Silver prices retreated marginally soon after hitting three-month highs around $32.50 per ounce.

By |2025-02-10T15:47:13+05:30February 10, 2025 3:47 pm|Forex|Comments Off on Forex Today: The BoE is expected to ease its monetary stance

Australian Dollar climbs as mixed US data boosts risk sentiment

  • Aussie nears 0.6300 amid cautious optimism on Wednesday.
  • Investors eye possible February rate cut from RBA.
  • Mid-tier US data came in mixed and weighed on the USD.

The Australian Dollar (AUD/USD) edges toward 0.6300, buoyed by mixed United States data that softened the Greenback and lifted broader risk assets. Nonetheless, anticipation of a dovish Reserve Bank of Australia (RBA) move next month tempers upside potential. Ongoing US-China trade tensions further cloud the outlook, restraining a more decisive rally in the Aussie.

Daily digest market movers: Aussie climbs amid mixed US data

  • President Donald Trump’s additional tariff on Chinese imports remains in effect, prompting China’s plan for new countermeasures and an antitrust investigation into Alphabet.
  • The United States has postponed a 25% duty on Canadian and Mexican imports for 30 days, contingent on border security commitments.
  • The ADP Employment Change report surprised with 183,000 new private-sector jobs, surpassing market estimates of 150,000.
  • Revised data from S&P Global show January Services at 52.9 and Composite at 52.7, both up from previous figures.
  • The Institute for Supply Management’s Services PMI declined to 52.8, missing the 54.3 forecast, while the Prices Paid component dropped to 60.4.
  • Markets are expecting that the Federal Reserve might hold rates steady in March, especially after mixed economic signals.
  • On the other hand, speculation of a 25 bps cut by the RBA in February weighs on the Aussie since inflation remains subdued.

AUD/USD technical outlook: Pair flirts with key resistance near 0.6300

The pair’s advance above the 20-day Simple Moving Average (SMA) around 0.6230 highlights recovering momentum, with the Aussie rising 0.67% to near 0.6300. The Relative Strength Index (RSI) stands at 58, hinting at growing bullish pressure, while the Moving Average Convergence Divergence (MACD) histogram’s decreasing green bars suggest lingering caution. Although improved risk sentiment encourages short-term gains, market bets on a February RBA rate cut and persistent trade disputes could cap upside potential.


Australian Dollar FAQs

One of the most significant factors for the Australian Dollar (AUD) is the level of interest rates set by the Reserve Bank of Australia (RBA). Because Australia is a resource-rich country another key driver is the price of its biggest export, Iron Ore. The health of the Chinese economy, its largest trading partner, is a factor, as well as inflation in Australia, its growth rate and Trade Balance. Market sentiment – whether investors are taking on more risky assets (risk-on) or seeking safe-havens (risk-off) – is also a factor, with risk-on positive for AUD.

The Reserve Bank of Australia (RBA) influences the Australian Dollar (AUD) by setting the level of interest rates that Australian banks can lend to each other. This influences the level of interest rates in the economy as a whole. The main goal of the RBA is to maintain a stable inflation rate of 2-3% by adjusting interest rates up or down. Relatively high interest rates compared to other major central banks support the AUD, and the opposite for relatively low. The RBA can also use quantitative easing and tightening to influence credit conditions, with the former AUD-negative and the latter AUD-positive.

China is Australia’s largest trading partner so the health of the Chinese economy is a major influence on the value of the Australian Dollar (AUD). When the Chinese economy is doing well it purchases more raw materials, goods and services from Australia, lifting demand for the AUD, and pushing up its value. The opposite is the case when the Chinese economy is not growing as fast as expected. Positive or negative surprises in Chinese growth data, therefore, often have a direct impact on the Australian Dollar and its pairs.

Iron Ore is Australia’s largest export, accounting for $118 billion a year according to data from 2021, with China as its primary destination. The price of Iron Ore, therefore, can be a driver of the Australian Dollar. Generally, if the price of Iron Ore rises, AUD also goes up, as aggregate demand for the currency increases. The opposite is the case if the price of Iron Ore falls. Higher Iron Ore prices also tend to result in a greater likelihood of a positive Trade Balance for Australia, which is also positive of the AUD.

The Trade Balance, which is the difference between what a country earns from its exports versus what it pays for its imports, is another factor that can influence the value of the Australian Dollar. If Australia produces highly sought after exports, then its currency will gain in value purely from the surplus demand created from foreign buyers seeking to purchase its exports versus what it spends to purchase imports. Therefore, a positive net Trade Balance strengthens the AUD, with the opposite effect if the Trade Balance is negative.

By |2025-02-10T15:45:16+05:30February 10, 2025 3:45 pm|Forex|Comments Off on Australian Dollar climbs as mixed US data boosts risk sentiment

NZD/USD Price Analysis: Pair extends rally, approaching the 0.5700 mark

  • NZD/USD advances nearly 0.70% on Wednesday, climbing to 0.5685.
  • The pair maintains its position above the 20-day SMA, reinforcing bullish momentum.
  • Bulls must conquer the 0.5700 area to confirm a recovery.

The NZD/USD pair extended its winning streak on Wednesday, posting a 0.67% gain to reach 0.5685. This upward move follows a breakout above the 20-day Simple Moving Average (SMA), which now acts as a key support level. The bullish sentiment appears to be strengthening, with the pair eyeing further gains toward the 0.5700 psychological threshold.

Technical indicators confirm the ongoing bullish trend. The Relative Strength Index (RSI) has surged to 58, indicating growing buying pressure, while the Moving Average Convergence Divergence (MACD) histogram continues to print rising green bars, reflecting a steady acceleration in momentum.

Looking ahead, NZD/USD faces an initial resistance zone at 0.5700, with a further upside target at 0.5735. On the downside, the 20-day SMA, currently near 0.5635, should act as the first line of support, followed by 0.5600 if a correction takes place. As long as the pair holds above the 20-day SMA, the short-term outlook remains in favor of the bulls.

NZD/USD daily chart

By |2025-02-10T12:50:13+05:30February 10, 2025 12:50 pm|Forex|Comments Off on NZD/USD Price Analysis: Pair extends rally, approaching the 0.5700 mark

USD/JPY Price Forecast: Turns bearish, breaches Ichimoku Cloud and 200-DMA

  • USD/JPY sinks 1.13%, falling sharply to 152.59 as it moves decisively below the 200-day SMA and Kumo.
  • Potential recovery hinges on reclaiming the 153.00 level, with resistance near the Kumo’s lower edge at 153.35/40.
  • Continued downtrend could target longer-term supports at December lows of 149.36 and 148.65.

The USD/JPY plummeted 175 pips on Wednesday, posting losses of over 1.13% as the pair cleared the Ichimoku Cloud (Kumo). This cements the pair’s downtrend, with the Japanese Yen (JPY) set to appreciate in the short term. At the time of writing, the pair trades at 152.59.

USD/JPY Price Forecast: Technical outlook

Bears stepped in on Wednesday, pushing the USD/JPY below the Kumo and breaching the 200-day Simple Moving Average (SMA) at 152.80. This has opened the door for further downside.

Despite this, a leg-up is on the cards, if buyers clear the 153.00 figure, which could pave the way to test the bottom of the Kumo at 153.35/40, offering sellers a better entry price. However, if it surpassed, the next resistance would be the 154.00 mark, followed by the February 5 high at 154.46.

If the downtrend continues, the USD/JPY first support would be the December 6 low of 149.36, followed by the December 3 low of 148.65.

USD/JPY Price Chart – Daily

By |2025-02-10T12:49:24+05:30February 10, 2025 12:49 pm|Forex|Comments Off on USD/JPY Price Forecast: Turns bearish, breaches Ichimoku Cloud and 200-DMA

USD/CAD trades with mild losses near 1.4300 as tariff worries ease

  • USD/CAD trades with mild negative bias around 1.4315 in Wednesday’s late Amercian session. 
  • Canada posts its first trade surplus in 10 months in December as exports continue to expand. 
  • US ISM Services PMI eased to 52.8 in January vs. 54.3 expected. 

The USD/CAD pair posts modest losses near 1.4315 during the late American session on Wednesday. The Canadian Dollar (CAD) edges higher as Canada’s trade balance shifted into surplus and US President Donald Trump delayed his orders to impose 25% tariffs on Canada for 30 days.

Canada in December reported its first trade surplus in ten months, with exports outpacing imports due to US businesses building up inventory ahead of potential tariffs, supporting the Loonie. Additionally, US tariffs provided relief from the looming trade war threat. Trump on Monday agreed to a 30-day pause on his tariff threats against Mexico and Canada as trading partners took steps to appease his concerns about border security and drug trafficking.

“Tariff worries are easing – for now, at least – which is allowing the CAD to stabilize,” said Shaun Osborne, chief currency strategist at Scotiabank. “Unless trade talks deteriorate significantly again, there is a chance that the USD-CAD peak reached Monday near 1.48 will represent a significant high-water mark for spot,” added Osborne.

Data released by the Institute for Supply Management (ISM) on Wednesday showed that the US Services Purchasing Managers’ Index (PMI) declined to 52.8 in January from 54.0 (revised from 54.1) in December. This reading came in weaker than the estimation of 54.3.

The US Dollar (USD) weakens in an immediate reaction to the downbeat US economic data. The US labor market data on Friday will be in the spotlight. In case of the stronger-than-expected outcome, this could boost the Greenback against the CAD in the near term.

Canadian Dollar FAQs

The key factors driving the Canadian Dollar (CAD) are the level of interest rates set by the Bank of Canada (BoC), the price of Oil, Canada’s largest export, the health of its economy, inflation and the Trade Balance, which is the difference between the value of Canada’s exports versus its imports. Other factors include market sentiment – whether investors are taking on more risky assets (risk-on) or seeking safe-havens (risk-off) – with risk-on being CAD-positive. As its largest trading partner, the health of the US economy is also a key factor influencing the Canadian Dollar.

The Bank of Canada (BoC) has a significant influence on the Canadian Dollar by setting the level of interest rates that banks can lend to one another. This influences the level of interest rates for everyone. The main goal of the BoC is to maintain inflation at 1-3% by adjusting interest rates up or down. Relatively higher interest rates tend to be positive for the CAD. The Bank of Canada can also use quantitative easing and tightening to influence credit conditions, with the former CAD-negative and the latter CAD-positive.

The price of Oil is a key factor impacting the value of the Canadian Dollar. Petroleum is Canada’s biggest export, so Oil price tends to have an immediate impact on the CAD value. Generally, if Oil price rises CAD also goes up, as aggregate demand for the currency increases. The opposite is the case if the price of Oil falls. Higher Oil prices also tend to result in a greater likelihood of a positive Trade Balance, which is also supportive of the CAD.

While inflation had always traditionally been thought of as a negative factor for a currency since it lowers the value of money, the opposite has actually been the case in modern times with the relaxation of cross-border capital controls. Higher inflation tends to lead central banks to put up interest rates which attracts more capital inflows from global investors seeking a lucrative place to keep their money. This increases demand for the local currency, which in Canada’s case is the Canadian Dollar.

Macroeconomic data releases gauge the health of the economy and can have an impact on the Canadian Dollar. Indicators such as GDP, Manufacturing and Services PMIs, employment, and consumer sentiment surveys can all influence the direction of the CAD. A strong economy is good for the Canadian Dollar. Not only does it attract more foreign investment but it may encourage the Bank of Canada to put up interest rates, leading to a stronger currency. If economic data is weak, however, the CAD is likely to fall.

By |2025-02-10T12:48:32+05:30February 10, 2025 12:48 pm|Forex|Comments Off on USD/CAD trades with mild losses near 1.4300 as tariff worries ease
Go to Top