About Ramya S

This author has not yet filled in any details.
So far Ramya S has created 155 blog entries.

EUR/USD stuck on familiar technical levels during midweek lull

  • EUR/USD remains hampered by 1.0400 key handle on Wednesday.
  • Overall market sentiment is keeping the Greenback underbid.
  • European Retail Sales due Thursday, US NFP coming Friday.

EUR/USD dragged its feet on Wednesday, finding some topside bidding action as a broad-market recovery in risk appetite keeps bids behind the US Dollar under pressure. The Euro is struggling to find its feet after snapping a six-day losing streak, and EUR/USD remains hobbled by the 1.0400 handle.

US ADP Employment Change figures showed stronger-than-expected results in January, with a net increase of 183K in payrolls, surpassing the anticipated drop to 150K from December’s revised figure of 176K. Although ADP job figures are an unreliable predictor of US Nonfarm Payrolls (NFP) expected at the end of the week, the increase is boosting investor confidence that the US economy remains on solid ground.

Pan-European Retail Sales figures from December are due early Thursday. Median market forecasts expect an upswing to 1.9% YoY compared to the previous period’s 1.2%. However, December’s MoM figure is expected to swing lower to -0.1% from 0.1%.

This week, the most important data release will be the US Nonfarm Payrolls (NFP) jobs report on Friday. Investors anticipate a decrease in January’s NFP figure to 170K from December’s 256K. Traders will also monitor revisions from prior months closely. Those expecting rate cuts have grown increasingly frustrated with the persistent strength of the US economy, as labor statistics often receive upward revisions afterward.

EUR/USD price forecast

EUR/USD kicked off the midweek market session with a bullish tilt, but tepid price action saw the pair flub the 1.0450 level with the 50-day Exponential Moving Average (EMA) weighing on intraday bids from 1.0445. Momentum is drying up ahead of key data prints, though Fiber has managed to recover from the early week’s plunge toward the 1.0200 handle.

EUR/USD daily chart

By |2025-02-10T12:45:55+05:30February 10, 2025 12:45 pm|Forex|Comments Off on EUR/USD stuck on familiar technical levels during midweek lull

NZD/USD gains ground to near 0.5700 on weaker US PMI data

  • NZD/USD posts modest gains around 0.5690 in Thursday’s early Asian session. 
  • US ISM Services PMI came in weaker-than-expected in January, declining to 52.8 vs. 54.3 expected.
  • The RBNZ dovish bets and concerns about the US-China renewed trade war could undermine the China-proxy Kiwi.

The NZD/USD pair trades with mild gains around 0.5690 during the early Asian session on Thursday. The downbeat US economic data drag the Greenback lower against the New Zealand Dollar (NZD). Investors will closely watch the developments surrounding the renewed trade war between the United States and China, the world’s two largest economies.

The weaker US Services Purchasing Manager Index (PMI) could weigh on the Greenback and create a tailwind for the pair. The US ISM Services PMI eased to 52.8 in January from 54.0 (revised from 54.1) in December. This reading came in below the market consensus of 54.3.

On the other hand, the New Zealand employment data for the fourth quarter (Q4) will keep the RBNZ on track to cut the Official Cash Rate (OCR) by 50 basis points (bps) to 3.75% this month. Data released by Statistics New Zealand on Wednesday revealed that the country’s Unemployment Rate rose to 5.1% in Q4 versus 4.8% prior. This figure registered a four-year high and was above the 25-year average of 4.8%. The rising bets that the Reserve Bank of New Zealand (RBNZ) will cut the interest rates might further weigh on the New Zealand Dollar (NZD).

“In line with RBNZ guidance, markets continue to imply another 50bps rate cut to 3.75% at the February 19 meeting and the policy rate to through around 3.00% over the next 12 months. Bottom line: NZ-US 2-year bond yield spreads can further weigh on NZD/USD,” noted Société Générale’s FX analysts.

On Tuesday, China’s finance ministry announced a package of tariffs on a range of US products, including crude oil, farm equipment, and some autos in an immediate response to a 10% tariff on Chinese imports announced by US President Donald Trump. Additionally, China put several companies, including Google, on notice for possible sanctions, in a measured response to Trump’s tariffs. Any signs of uncertainty or escalating trade war tension could drag the China-proxy Kiwi lower as China is a major trading partner to New Zealand.

New Zealand Dollar FAQs

The New Zealand Dollar (NZD), also known as the Kiwi, is a well-known traded currency among investors. Its value is broadly determined by the health of the New Zealand economy and the country’s central bank policy. Still, there are some unique particularities that also can make NZD move. The performance of the Chinese economy tends to move the Kiwi because China is New Zealand’s biggest trading partner. Bad news for the Chinese economy likely means less New Zealand exports to the country, hitting the economy and thus its currency. Another factor moving NZD is dairy prices as the dairy industry is New Zealand’s main export. High dairy prices boost export income, contributing positively to the economy and thus to the NZD.

The Reserve Bank of New Zealand (RBNZ) aims to achieve and maintain an inflation rate between 1% and 3% over the medium term, with a focus to keep it near the 2% mid-point. To this end, the bank sets an appropriate level of interest rates. When inflation is too high, the RBNZ will increase interest rates to cool the economy, but the move will also make bond yields higher, increasing investors’ appeal to invest in the country and thus boosting NZD. On the contrary, lower interest rates tend to weaken NZD. The so-called rate differential, or how rates in New Zealand are or are expected to be compared to the ones set by the US Federal Reserve, can also play a key role in moving the NZD/USD pair.

Macroeconomic data releases in New Zealand are key to assess the state of the economy and can impact the New Zealand Dollar’s (NZD) valuation. A strong economy, based on high economic growth, low unemployment and high confidence is good for NZD. High economic growth attracts foreign investment and may encourage the Reserve Bank of New Zealand to increase interest rates, if this economic strength comes together with elevated inflation. Conversely, if economic data is weak, NZD is likely to depreciate.

The New Zealand Dollar (NZD) tends to strengthen during risk-on periods, or when investors perceive that broader market risks are low and are optimistic about growth. This tends to lead to a more favorable outlook for commodities and so-called ‘commodity currencies’ such as the Kiwi. Conversely, NZD tends to weaken at times of market turbulence or economic uncertainty as investors tend to sell higher-risk assets and flee to the more-stable safe havens.

By |2025-02-10T12:44:59+05:30February 10, 2025 12:44 pm|Forex|Comments Off on NZD/USD gains ground to near 0.5700 on weaker US PMI data

Australian Dollar remains subdued following Trade Balance data

  • The Australian Dollar holds losses after the release of lower-than-expected Trade Balance data.
  • Australia’s trade surplus dropped to 5,085M in December, below the expected 7,000M and down from the 6,792M prior.
  • The US Dollar faced challenges as the ISM Services PMI eased in January.

The Australian Dollar (AUD) edges lower against the US Dollar (USD) following lower-than-expected Trade Balance data released on Thursday. Additionally, the AUD/USD pair receives downward pressure from risk-off sentiment amid rising fears over US-China trade tensions.

Australia’s trade surplus fell to 5,085M in December, missing the expected 7,000M and down from the previous surplus of 6,792M. Exports increased by 1.1% MoM, slowing from November’s 4.2% rise, while imports surged 5.9% MoM, up from 1.4% in the prior month.

Traders closely watch the ongoing trade war between the United States (US) and China, Australia’s key trading partner. China retaliated against the new 10% US tariff that took effect on Tuesday. However, Trump stated on Monday afternoon that he would likely speak with China within the next 24 hours. He also warned, “If we can’t reach a deal with China, the tariffs will be very, very substantial.”

Australian Dollar receives downward pressure from rising US-China trade tensions

  • The US Dollar Index (DXY), which measures the US Dollar’s value against six major currencies, remains under subdued near 107.50 at the time of writing. The weaker US Services Purchasing Manager Index (PMI) could have weighed on the Greenback.
  • The US ISM Services PMI eased to 52.8 in January from 54.0 (revised from 54.1) in December. This reading came in below the market consensus of 54.3.
  • Traders brace for Friday’s US Nonfarm Payrolls (NFP) data, which is expected to shape the Federal Reserve’s (Fed) monetary policy direction.
  • President Trump has agreed to a 30-day suspension of the proposed 25% tariffs on Canadian and Mexican imports. This decision comes after Canadian Prime Minister Justin Trudeau and Mexican President Claudia Sheinbaum committed to enhancing border security measures to address concerns over illegal immigration and drug trafficking.
  • China’s Commerce Ministry announced that it will impose a 15% tariff on US coal and liquefied natural gas (LNG) imports, along with an additional 10% tariff on crude Oil, farm equipment, and certain automobiles. Additionally, to “safeguard national security interests,” China is implementing export controls on tungsten, tellurium, ruthenium, molybdenum, and related products.
  • According to the Financial Times, Chinese exporters are intensifying their efforts to offshore production in response to Trump’s tariffs. Manufacturers in China are accelerating plans to relocate production to other countries, including the Middle East, to avoid US tariffs. Other tactics being considered include passing the increased costs onto US consumers and exploring alternative markets.
  • JOLTS Job Openings fell to 7.6 million in December, missing the 8 million consensus estimate. The US labor market remains stable with total separations little changed at 5.3 million in December.
  • San Francisco Fed Bank President Mary Daly stated on Tuesday that the central bank remains in a wait-and-see stance, emphasizing the impact of economic uncertainty on policymaking. While the economy is performing well and maintaining momentum, uncertainty persists. As a result, the Fed has the flexibility to carefully assess data before making policy adjustments.
  • Australia’s Judo Bank Composite PMI climbed to 51.1 in January from 50.2 in December, reflecting modest growth in private sector activity. Meanwhile, the Judo Bank Services PMI rose to 51.2 from 50.8, marking the twelfth consecutive month of expansion in the services sector. Although growth was moderate, it was the strongest since August.

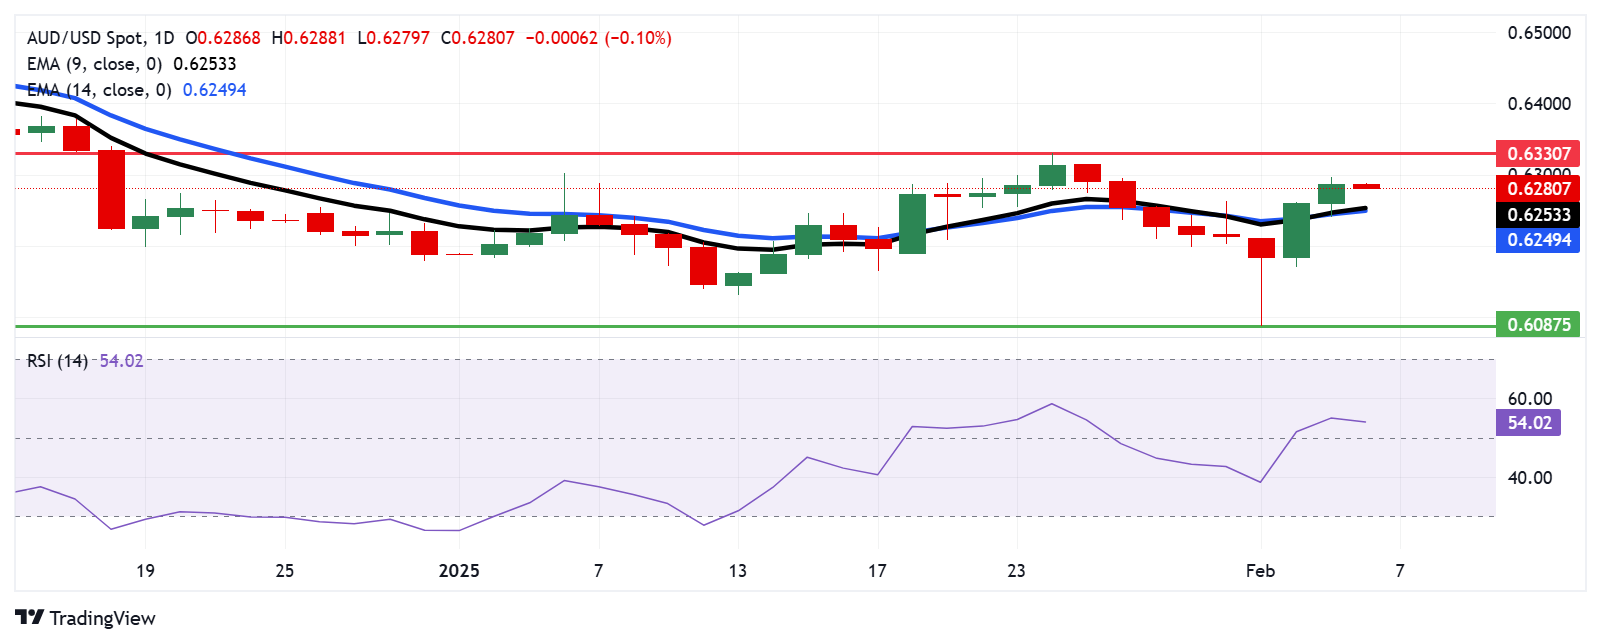
Australian Dollar pulls back from 0.6300, support appears at nine-day EMA

The AUD/USD pair trades near 0.6280 on Thursday. Sustained price action above the nine- and 14-day Exponential Moving Averages (EMAs) on the daily chart indicates a stronger short-term bullish momentum. Additionally, the 14-day Relative Strength Index (RSI) is positioned above the 50 level, confirming a stronger bullish trend.

On the upside, the AUD/USD pair could explore the area around its seven-week high at 0.6330 level, which was recorded on January 24.

The AUD/USD pair may find immediate support at the nine-day EMA near 0.6254, followed by the 14-day EMA at 0.6249 level. A break below these EMAs could weaken the bullish bias, potentially driving the pair toward 0.6087, the lowest level since April 2020, which was recorded on February 3.

AUD/USD: Daily Chart

By |2025-02-10T12:43:50+05:30February 10, 2025 12:43 pm|Forex|Comments Off on Australian Dollar remains subdued following Trade Balance data

Japan’s Kato sees inflation pressure continuing to rise

Japan’s Finance Minister, Katsunobu Kato, said on Thursday that the end of deflation has not yet been achieved. Kato further stated that he sees inflationary conditions as prices continue to rise.

Market reaction

At the press time, the USD/JPY pair is down 0.24% on the day to trade at 152.32.

Japanese Yen FAQs

The Japanese Yen (JPY) is one of the world’s most traded currencies. Its value is broadly determined by the performance of the Japanese economy, but more specifically by the Bank of Japan’s policy, the differential between Japanese and US bond yields, or risk sentiment among traders, among other factors.

One of the Bank of Japan’s mandates is currency control, so its moves are key for the Yen. The BoJ has directly intervened in currency markets sometimes, generally to lower the value of the Yen, although it refrains from doing it often due to political concerns of its main trading partners. The BoJ ultra-loose monetary policy between 2013 and 2024 caused the Yen to depreciate against its main currency peers due to an increasing policy divergence between the Bank of Japan and other main central banks. More recently, the gradually unwinding of this ultra-loose policy has given some support to the Yen.

Over the last decade, the BoJ’s stance of sticking to ultra-loose monetary policy has led to a widening policy divergence with other central banks, particularly with the US Federal Reserve. This supported a widening of the differential between the 10-year US and Japanese bonds, which favored the US Dollar against the Japanese Yen. The BoJ decision in 2024 to gradually abandon the ultra-loose policy, coupled with interest-rate cuts in other major central banks, is narrowing this differential.

The Japanese Yen is often seen as a safe-haven investment. This means that in times of market stress, investors are more likely to put their money in the Japanese currency due to its supposed reliability and stability. Turbulent times are likely to strengthen the Yen’s value against other currencies seen as more risky to invest in.

By |2025-02-10T12:42:29+05:30February 10, 2025 12:42 pm|Forex|Comments Off on Japan’s Kato sees inflation pressure continuing to rise

Fed’s Jefferson: Happy to keep Fed Funds on hold at current rate

Federal Reserve Vice Chair Philip Jefferson said on Thursday that he is happy to keep the Fed Funds on hold at the current level, adding that he will wait to see the net effect of Trump policies.

Key quotes

Waits to see net effect of Trump policies.

Examining overall impact of Trump administration on policy goals needed.

Opts to maintain current interest rates for the time being.

Content with current policy level until totality of impacts better understood.

Sees Fed’s ability to be patient with the economy in a good place.

Fed’s rate still restrictive even with 100 bp drop.

Policy rate remains restrictive for the economy.

Market reaction

The US Dollar Index (DXY) is trading unchanged on the day at 107.60, as of writing.

By |2025-02-10T12:41:26+05:30February 10, 2025 12:41 pm|Forex|Comments Off on Fed’s Jefferson: Happy to keep Fed Funds on hold at current rate

AUD/JPY drops to near 95.50 as Australia’s trade surplus shrinks to a three-month low

  • AUD/JPY loses ground as Australia’s trade surplus fell to 5,085M in December, the smallest balance since last September.
  • The AUD faces challenges amid increased dovish sentiment surrounding the RBA’s upcoming policy decision.
  • The Japanese Yen gains strength as solid wage and services data boost expectations of a more hawkish BoJ.

AUD/JPY extends its losses for the second successive day, trading around 95.60 during the Asian hours on Thursday. This decline of the cross is attributed to the subdued Australian Dollar (AUD) following the lower-than-expected Trade Balance data release.

Australia’s trade surplus fell to 5,085M in December, missing the expected 7,000M and down from the previous surplus of 6,792M. This was the smallest balance since last September. Exports increased by 1.1% MoM, slowing from November’s 4.2% rise, while imports surged 5.9% MoM, up from 1.4% in the prior month.

The weaker trade balance data in Australia bolsters the dovish sentiment surrounding the upcoming Reserve Bank of Australia’s (RBA) policy decision. The central bank is widely anticipated to deliver a rate cut in February. The RBA has maintained the Official Cash Rate (OCR) at 4.35% since November 2023, emphasizing that inflation must “sustainably” return to its 2%-3% target range before any policy easing.

Additionally, the AUD/JPY cross receives downward pressure from risk-off sentiment amid rising fears over US-China trade tensions. China, Australia’s key trading partner, retaliated against the new 10% US tariff that took effect on Tuesday. However, Trump stated on Monday afternoon that he would likely speak with China within the next 24 hours. He also warned, “If we can’t reach a deal with China, the tariffs will be very, very substantial.”

The Japanese Yen (JPY) strengthens against its peers as robust wage and services data fuel expectations of a more hawkish Bank of Japan (BoJ). Data showed that real wages in Japan increased for the second straight month in December, while nominal wage growth reached its highest level in nearly three decades.

Japan’s Finance Minister, Katsunobu Kato, told parliament on Thursday that deflation has not yet ended. Kato also noted ongoing inflationary conditions as prices continue to rise.

Société Générale’s FX analysts noted that the Japanese Yen is outperforming, while 10-year JGB yields have risen to nearly 1.30%, the highest level since April 2011. However, with the BoJ policy rate expected to peak around 1.00% over the next two years, the upside for both JPY and JGB yields remains limited.

Economic Indicator

Trade Balance (MoM)

The trade balance released by the Australian Bureau of Statistics is the difference in the value of its imports and exports of Australian goods. Export data can give an important reflection of Australian growth, while imports provide an indication of domestic demand. Trade Balance gives an early indication of the net export performance. If a steady demand in exchange for Australian exports is seen, that would turn into a positive growth in the trade balance, and that should be positive for the AUD.

Read more.

Last release: Thu Feb 06, 2025 00:30

Frequency: Monthly

Actual: 5,085M

Consensus: 7,000M

Previous: 7,079M

Source: Australian Bureau of Statistics

By |2025-02-10T12:40:21+05:30February 10, 2025 12:40 pm|Forex|Comments Off on AUD/JPY drops to near 95.50 as Australia’s trade surplus shrinks to a three-month low

WTI remains on the defensive near $71.00 amid a rise in US oil stockpiles and concern about US-China trade

  • WTI price edges lower to around $71.00 in Thursday’s early Asian session.
  • US crude oil stockpiles rose by 8.664 million barrels last week, according to the EIA. 
  • Oil traders worry about China-US trade. 

West Texas Intermediate (WTI), the US crude oil benchmark, is trading around $71.00 during the early Asian session on Thursday. The WTI price edges lower amid a large build in US crude stockpiles and worries about renewed US-China trade tensions.

US crude inventories rose sharply last week, signaling weaker demand. The US Energy Information Administration (EIA) weekly report showed crude oil stockpiles in the United States for the week ending January 31 climbed by 8.664 million barrels, compared to a rise of 3.463 million barrels in the previous week. The market consensus estimated that stocks would increase by 3.2 million barrels.

Concerns of a potential trade war between the United States and China, the world’s top energy importer, could exert some selling pressure on the WTI price. On Tuesday, China’s finance ministry announced a package of tariffs on a range of US products, including crude oil, farm equipment, and some autos in an immediate response to a 10% tariff on Chinese imports announced by US President Donald Trump. Additionally, China put several companies, including Google, on notice for possible sanctions in a measured response to Trump’s tariffs.

On Wednesday, Iran’s President Masoud Pezeshkian called OPEC members to unite against potential US sanctions after Trump’s announcement of resuming the “maximum pressure” campaign against Iran during his first term. Meanwhile, Russia’s Deputy Prime Minister Alexander Novak said that the group of ministers from OPEC and allies headed by Russia (OPEC+) reviewed Trump’s proposal to increase production and decided that OPEC+ would begin increasing output on April 1 in accordance with previous plans.

WTI Oil FAQs

WTI Oil is a type of Crude Oil sold on international markets. The WTI stands for West Texas Intermediate, one of three major types including Brent and Dubai Crude. WTI is also referred to as “light” and “sweet” because of its relatively low gravity and sulfur content respectively. It is considered a high quality Oil that is easily refined. It is sourced in the United States and distributed via the Cushing hub, which is considered “The Pipeline Crossroads of the World”. It is a benchmark for the Oil market and WTI price is frequently quoted in the media.

Like all assets, supply and demand are the key drivers of WTI Oil price. As such, global growth can be a driver of increased demand and vice versa for weak global growth. Political instability, wars, and sanctions can disrupt supply and impact prices. The decisions of OPEC, a group of major Oil-producing countries, is another key driver of price. The value of the US Dollar influences the price of WTI Crude Oil, since Oil is predominantly traded in US Dollars, thus a weaker US Dollar can make Oil more affordable and vice versa.

The weekly Oil inventory reports published by the American Petroleum Institute (API) and the Energy Information Agency (EIA) impact the price of WTI Oil. Changes in inventories reflect fluctuating supply and demand. If the data shows a drop in inventories it can indicate increased demand, pushing up Oil price. Higher inventories can reflect increased supply, pushing down prices. API’s report is published every Tuesday and EIA’s the day after. Their results are usually similar, falling within 1% of each other 75% of the time. The EIA data is considered more reliable, since it is a government agency.

OPEC (Organization of the Petroleum Exporting Countries) is a group of 12 Oil-producing nations who collectively decide production quotas for member countries at twice-yearly meetings. Their decisions often impact WTI Oil prices. When OPEC decides to lower quotas, it can tighten supply, pushing up Oil prices. When OPEC increases production, it has the opposite effect. OPEC+ refers to an expanded group that includes ten extra non-OPEC members, the most notable of which is Russia.

By |2025-02-10T12:39:27+05:30February 10, 2025 12:39 pm|Crude Oil|Comments Off on WTI remains on the defensive near $71.00 amid a rise in US oil stockpiles and concern about US-China trade

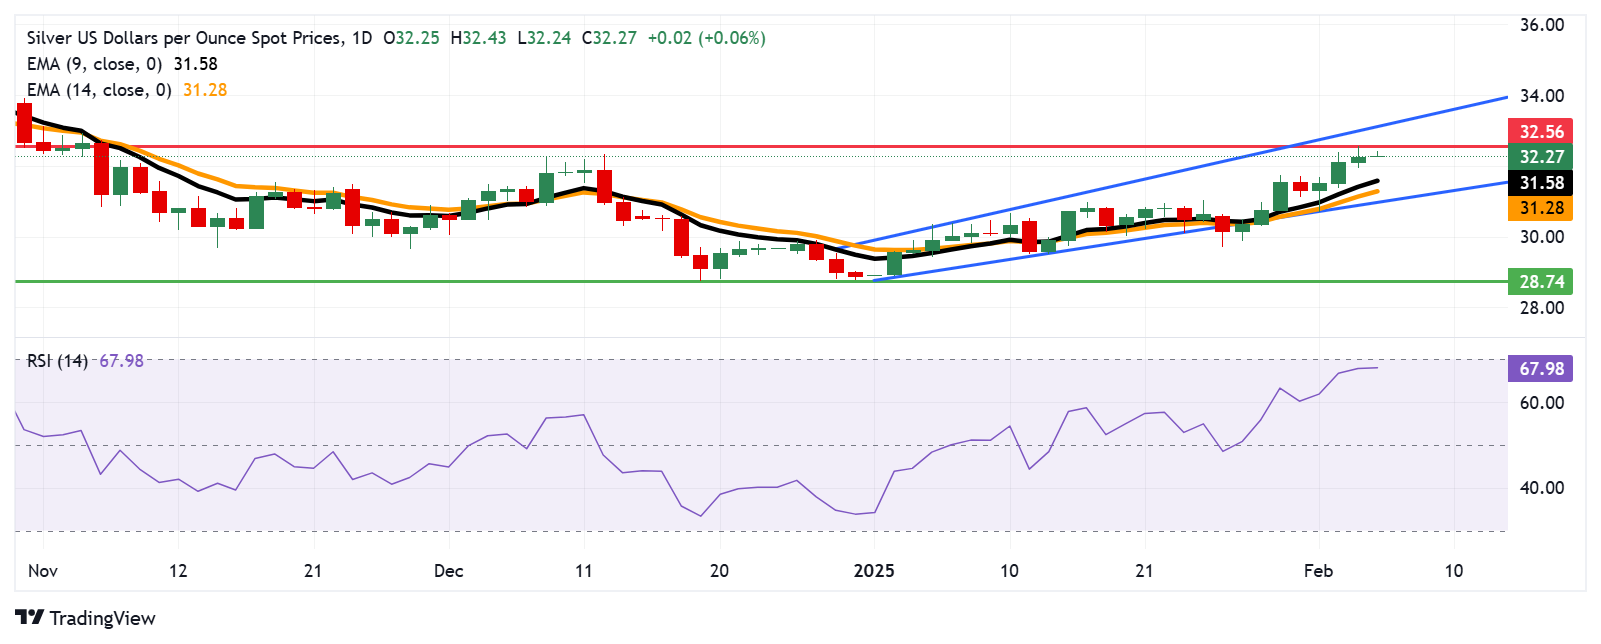
Silver Price Forecast: XAG/USD maintains position around $32.50, three-month highs

  • Silver price holds ground near its three-month high of $32.56, recorded on February 5.
  • A break above the 70 RSI level could indicate overbought conditions, potentially triggering a downward correction.
  • The critical support zone appears at a nine-day EMA at $31.58, followed by the ascending channel’s lower boundary at $31.00.

Silver price (XAG/USD) extends its winning streak for the fourth consecutive session, trading near $32.30 per troy ounce during Asian hours on Thursday. Technical analysis on the daily chart highlights a strong bullish bias, with the price maintaining an upward trajectory within an ascending channel.

The XAG/USD pair remains above both the nine-day and 14-day Exponential Moving Averages (EMAs), indicating solid short-term momentum. Additionally, the 14-day Relative Strength Index (RSI) is approaching the 70 level, reinforcing bullish sentiment. A break above the 70 mark could signal overbought conditions, potentially leading to a downward correction.

On the upside, Silver price faces immediate resistance at its three-month high of $32.56, last reached on February 5. A decisive breakout above this level could pave the way for a test of the ascending channel’s upper boundary at $33.10.

Support levels include the nine-day EMA at $31.58, followed by the 14-day EMA at $31.28, and the lower boundary of the ascending channel at $31.00. A drop below this critical support zone could weaken the bullish outlook, exposing the XAG/USD pair to further downside toward its five-month low of $28.74, recorded on December 19.

XAG/USD: Daily Chart

By |2025-02-10T12:38:31+05:30February 10, 2025 12:38 pm|Gold Silver|Comments Off on Silver Price Forecast: XAG/USD maintains position around $32.50, three-month highs

USD/INR gathers strength amid RBI rate cut expectations

  • The Indian Rupee extends its decline in Thursday’s Asian session. 
  • Rising bets of RBI rate cuts and risk aversion continue to undermine the INR. 
  • The RBI interest rate decision and the US January employment report will be in the spotlight on Friday. 

The Indian Rupee (INR) extends its downside on Thursday. The local currency remains under selling pressure amid the expectation that the Reserve Bank of India (RBI) might cut the interest rates on Friday. Additionally, global trade war concerns fuelled risk aversion among investors, weighing on the INR.

Nonetheless, the foreign exchange intervention by the RBI and a decline in crude oil prices might help limit the Indian Rupee’s losses. Later on Thursday, the US weekly Initial Jobless Claims, Unit Labor Costs and Nonfarm Productivity will be released. The attention will shift to the RBI interest rate decision and the US January employment data on Friday.

Indian Rupee falls as India’s new RBI Governor is set to begin rate cuts

  • Most of the economists surveyed by Bloomberg anticipate the Indian central bank to lower the benchmark repurchase rate by at least 25 basis points (bps) to 6.25% on Friday.
  • HSBC India Composite PMI came in at 57.7 in January. This figure came in weaker than the previous reading and the estimation of 57.9.
  • HSBC India Services PMI eased to a two-year low of 56.5 in January versus 56.8 prior, lower than expected.
  • “India’s services sector lost growth momentum in January, although the PMI remained well above the 50-break-even level. The business activity and new business PMI indices eased to their lowest levels since November 2022 and November 2023, respectively,” said Pranjul Bhandari, Chief India Economist at HSBC.
  • The US Services PMI eased to 52.8 in January from 54.0 (revised from 54.1) in December, according to the Institute for Supply Management (ISM) on Wednesday. This reading came in below the market consensus of 54.3.
  • Fed Vice Chair Philip Jefferson said on Thursday that he is happy to keep the Fed Funds on hold at the current level, adding that he will wait to see the net effect of Trump policies.

USD/INR maintains its positive trend

The Indian Rupee trades in negative territory on the day. The bullish view of the USD/INR pair prevails, characterized by the price holding above the key 100-day Exponential Moving Average (EMA). However, further consolidation cannot be ruled out before positioning for any near-term USD/INR appreciation as the 14-day Relative Strength Index (RSI) moves beyond the 70.00 mark.

The first upside barrier for USD/INR emerges at 87.49, an all-time high. Bullish candlesticks and buying pressure above this level might attract the pair to the 88.00 psychological level.

On the other hand, the 87.05-87.00 area acts as an initial support level for the pair, representing the low of February 5 and the round mark. More bearish candles or consistent trading below the mentioned level, the bears could take control and drag USD/INR down to 86.51, the low of February 3.

Indian Rupee FAQs

The Indian Rupee (INR) is one of the most sensitive currencies to external factors. The price of Crude Oil (the country is highly dependent on imported Oil), the value of the US Dollar – most trade is conducted in USD – and the level of foreign investment, are all influential. Direct intervention by the Reserve Bank of India (RBI) in FX markets to keep the exchange rate stable, as well as the level of interest rates set by the RBI, are further major influencing factors on the Rupee.

The Reserve Bank of India (RBI) actively intervenes in forex markets to maintain a stable exchange rate, to help facilitate trade. In addition, the RBI tries to maintain the inflation rate at its 4% target by adjusting interest rates. Higher interest rates usually strengthen the Rupee. This is due to the role of the ‘carry trade’ in which investors borrow in countries with lower interest rates so as to place their money in countries’ offering relatively higher interest rates and profit from the difference.

Macroeconomic factors that influence the value of the Rupee include inflation, interest rates, the economic growth rate (GDP), the balance of trade, and inflows from foreign investment. A higher growth rate can lead to more overseas investment, pushing up demand for the Rupee. A less negative balance of trade will eventually lead to a stronger Rupee. Higher interest rates, especially real rates (interest rates less inflation) are also positive for the Rupee. A risk-on environment can lead to greater inflows of Foreign Direct and Indirect Investment (FDI and FII), which also benefit the Rupee.

Higher inflation, particularly, if it is comparatively higher than India’s peers, is generally negative for the currency as it reflects devaluation through oversupply. Inflation also increases the cost of exports, leading to more Rupees being sold to purchase foreign imports, which is Rupee-negative. At the same time, higher inflation usually leads to the Reserve Bank of India (RBI) raising interest rates and this can be positive for the Rupee, due to increased demand from international investors. The opposite effect is true of lower inflation.

By |2025-02-10T12:37:40+05:30February 10, 2025 12:37 pm|Forex|Comments Off on USD/INR gathers strength amid RBI rate cut expectations

GBP/USD steadies around 1.2500, downside risks appear due to dovish mood surrounding BoE

  • GBP/USD moves little as traders adopt caution ahead of the BoE’s interest rate decision on Thursday.
  • The BoE is widely anticipated to deliver a 25 basis point rate cut in February.
  • The US ISM Services PMI eased to 52.8 in January from 54.0 in December.

GBP/USD halts its three-day winning streak, trading around 1.2490 during the Asian hours on Thursday. The Pound Sterling (GBP) could face downward pressure amid expectations that the Bank of England (BoE) will resume its policy-easing cycle, likely lowering interest rates by 25 basis points (bps) to 4.5% later in the day.

The BoE’s Monetary Policy Committee (MPC) is anticipated to vote 8-1 in favor of a quarter-point rate cut to 4.5%, with one member possibly suggesting that rates should be left unchanged for another meeting.

The GBP/USD pair inches lower as the US Dollar Index (DXY), which measures the US Dollar’s (USD) value against six major currencies, holds ground following its three-day losing streak. The DXY trades around 107.60 at the time of writing.

On Thursday, Federal Reserve Vice Chair Philip Jefferson expressed his satisfaction with keeping the Fed Funds rate at its current level, stating that he would assess the overall impact of Trump’s policies before making further decisions. He also emphasized that the Fed’s rate remains restrictive for the economy, even with a 100-basis-point decline.

On Wednesday, the weaker US Services Purchasing Manager Index (PMI) weighed on the Greenback. The US ISM Services PMI eased to 52.8 in January from 54.0 (revised from 54.1) in December. This reading came in below the market consensus of 54.3. Traders brace for Friday’s US Nonfarm Payrolls (NFP) data, which is expected to shape the Federal Reserve’s (Fed) monetary policy direction.

Economic Indicator

BoE Interest Rate Decision

The Bank of England (BoE) announces its interest rate decision at the end of its eight scheduled meetings per year. If the BoE is hawkish about the inflationary outlook of the economy and raises interest rates it is usually bullish for the Pound Sterling (GBP). Likewise, if the BoE adopts a dovish view on the UK economy and keeps interest rates unchanged, or cuts them, it is seen as bearish for GBP.

Read more.

Next release: Thu Feb 06, 2025 12:00

Frequency: Irregular

Consensus: 4.5%

Previous: 4.75%

Source: Bank of England

By |2025-02-10T12:36:28+05:30February 10, 2025 12:36 pm|Forex|Comments Off on GBP/USD steadies around 1.2500, downside risks appear due to dovish mood surrounding BoE
Go to Top