About Ramya S

This author has not yet filled in any details.
So far Ramya S has created 155 blog entries.

USD/JPY: USD is likely to trade in a range – UOB Group

US Dollar (USD) is under mild downward pressure; it could edge lower, but any decline is unlikely to break below 153.70. In the longer run, for the time being, USD is likely to trade in a 153.70/156.70 range, UOB Group’s FX analysts Quek Ser Leang and Peter Chia note.

USD is under mild downward pressure

24-HOUR VIEW: “Following Monday’s choppy price action, we indicated yesterday that USD ‘could continue to trade in an erratic manner, probably in a range of 154.50/156.00.’ We did not expect USD to drop to a low of 154.16, closing at 154.33 (-0.27%). The decline has resulted in a slight increase in downward momentum. Today, we expect USD to edge lower, but given the mild downward momentum, any decline is unlikely to break below the major support at 153.70. On the upside, a breach of 155.00 (minor resistance is at 154.70) would suggest that the mild downward pressure has faded.”

1-3 WEEKS VIEW: “There is not much to our update from yesterday (04 Feb, spot at 155.20). As indicated, USD ‘is likely to trade in a 153.70/156.70 range for the time being.’ Looking ahead, if USD were to break and remain below 153.70, it could trigger a sustained drop.”

By |2025-02-12T16:20:24+05:30February 12, 2025 4:20 pm|Forex|Comments Off on USD/JPY: USD is likely to trade in a range – UOB Group

USD/JPY: High achieved last week at 156.25 could cap upside – BBH

USD/JPY recently formed a lower peak near 158.85 than the one achieved last year at 162, BBH FX analysts report.

Next bearish objectives are located at 151.50 and 151.00/150.80

“Daily MACD has been posting negative divergence and has now dipped below equilibrium line highlighting regain of downward momentum. This is also highlighted by break below a multi-month ascending trend line. The pair is now close to the 200-DMA at 152.80/152.50 which could be a potential support, but signals of a large bounce are not yet visible.”

“High achieved last week at 156.25 could cap upside. Below the MA, next objectives are located at 151.50, the 38.2% retracement from September and projections at 151.00/150.80.”


By |2025-02-12T16:17:56+05:30February 12, 2025 4:17 pm|Forex|Comments Off on USD/JPY: High achieved last week at 156.25 could cap upside – BBH

EUR/USD advances as investors see limited trade war between US and China

  • EUR/USD rises above 1.0400 as the risk-premium of the US Dollar eases amid diminishing fears of a global trade war.
  • The ECB is expected to continue reducing interest rates amid confidence that the disinflation trend towards the 2% target is intact.
  • Investors await the US ADP Employment Change and the ISM Services PMI for January. 

EUR/USD advances above 1.0400 in Wednesday’s European session. The major currency pair gains as the US Dollar (USD) extends its losing streak for the third trading day.

The US Dollar Index (DXY), which tracks the Greenback’s value against six major currencies, declines to near 107.50 as it loses some risk premium, with investors assuming that the scope of a trade war won’t be wider.

Market participants expect the trade war to be mainly between the United States (US) and China as the latter has retaliated against 10% levies by imposing tariffs on various US exports, including farm equipment, some autos, and energy items such as Coal and Liquefied Natural Gas (LNG).

With the rest of the world, investors expect US President Donald Trump will use tariffs as a tool to have a dominant position in negotiating deals with trading partners. President Trump’s postponement of 25% tariffs on Canada and Mexico stemmed from expectations that tariffs are more of a political maneuver.

Meanwhile, the next trigger for the US Dollar (USD) will be the US Nonfarm Payrolls (NFP) data for January, which will be released on Friday. The official employment data is expected to influence speculation about the Federal Reserve’s (Fed) monetary policy guidance.

In Wednesday’s session, investors will focus on the US ADP Employment Change and the ISM Services Purchasing Managers Index (PMI) data for January.

Daily digest market movers: EUR/USD gains sharply despite Euro’s underperformance

  • EUR/USD moves higher at the expense of the US Dollar as the Euro (EUR) underperforms against its major peers amid firm expectations that the European Central Bank (ECB) will continue with its policy-easing spree, given that officials are confident about inflation sustainably returning to the central bank’s target of 2% this year.
  • In Wednesday’s European session, ECB Vice President Luis de Guindos said in an interview with the Slovak newspaper Hospodarske Noviny that he sees “inflation approaching the ECB’s target” but expects “little uptick in next few months on energy”. When asked about for how long the ECB will continue reducing its borrowing rates, de Guindos said, “Even if our current trajectory under the current circumstances is clear, nobody knows the level at which interest rates will end up.”
  • Last week, the ECB reduced its Deposit Facility rate by 25 basis points (bps) to 2.75% and guided that the monetary policy is still restrictive. Traders expect the ECB to cut interest rates three times more in the next three policy meetings.
  • Meanwhile, market participants are cautious about the Eurozone outlook amid fears that the European Union (EU) will be the next on the list of US President Trump on whom he can threaten to impose tariffs actively. Over the weekend, Trump said that tariffs would definitely happen with the European Union because “they’ve really taken advantage of us”.

Technical Analysis: EUR/USD rebounds to near 1.0400

By |2025-02-11T20:45:32+05:30February 11, 2025 8:45 pm|Forex|Comments Off on EUR/USD advances as investors see limited trade war between US and China

USD/CAD slumps below 1.4300 as CAD capitalizes on Trump’s suspension of tariff orders

  • USD/CAD falls sharply below 1.4300 as the Canadian Dollar continues to advance on US President Trump’s decision to postpone tariffs on Canada.
  • BofA expects US tariff threats to China will continue to persist until a new USMCA deal gets negotiated.
  • Investors await the US ISM Services PMI and the ADP Employment data for December.

The USD/CAD pair extends its losing streak below the key level of 1.4300 in Wednesday’s European session. The Loonie pair weakens as the Canadian Dollar (CAD) continues to gain, given that United States (US) President Donald Trump delayed his orders to impose 25% tariffs on Canada for 30 days. President Trump suspended orders after Canada agreed for criminal enforcement at borders to stop the flow of drugs and undocumented immigrants into the US.

A suspension in tariff orders on Canada has forced market experts to revise the Canadian economic outlook, who were accounting for the impact of levies. While the Canadian Dollar has surged this week against the US Dollar due to a relief rally from Trump’s decision to put the tariff plan on hold, analysts at Bank of America (BofA) expect the rally is unlikely to sustain as US tariffs threats and headlines on Canada to persist until a “new United States-Mexico-Canada Agreement (USMCA) deal is negotiated”.

This week, investors will focus on the Canadian employment data for January, which will be released on Friday. The employment report is expected to show that the economy added 25K workers, significantly fewer than 90.9K addition seen in December. The Unemployment Rate is estimated to have accelerated to 6.8% from the former release of 6.7%.

The labor market data will influence market expectations for the Bank of Canada’s (BoC) monetary policy outlook. Currently, traders expect the BoC to cut interest rates by 25 basis points (bps) to 2.75% in the March meeting.

Meanwhile, the US Dollar (USD) underperforms its major peers as the market sentiment turns cheerful amid expectations that Trump’s tariff agenda would be less fearful than expected.

On the economic front, investors will focus on the US ADP Employment Change and the ISM Services PMI data for January, which will be published in Wednesday’s North American session.

Canadian Dollar FAQs

The key factors driving the Canadian Dollar (CAD) are the level of interest rates set by the Bank of Canada (BoC), the price of Oil, Canada’s largest export, the health of its economy, inflation and the Trade Balance, which is the difference between the value of Canada’s exports versus its imports. Other factors include market sentiment – whether investors are taking on more risky assets (risk-on) or seeking safe-havens (risk-off) – with risk-on being CAD-positive. As its largest trading partner, the health of the US economy is also a key factor influencing the Canadian Dollar.

The Bank of Canada (BoC) has a significant influence on the Canadian Dollar by setting the level of interest rates that banks can lend to one another. This influences the level of interest rates for everyone. The main goal of the BoC is to maintain inflation at 1-3% by adjusting interest rates up or down. Relatively higher interest rates tend to be positive for the CAD. The Bank of Canada can also use quantitative easing and tightening to influence credit conditions, with the former CAD-negative and the latter CAD-positive.

The price of Oil is a key factor impacting the value of the Canadian Dollar. Petroleum is Canada’s biggest export, so Oil price tends to have an immediate impact on the CAD value. Generally, if Oil price rises CAD also goes up, as aggregate demand for the currency increases. The opposite is the case if the price of Oil falls. Higher Oil prices also tend to result in a greater likelihood of a positive Trade Balance, which is also supportive of the CAD.

While inflation had always traditionally been thought of as a negative factor for a currency since it lowers the value of money, the opposite has actually been the case in modern times with the relaxation of cross-border capital controls. Higher inflation tends to lead central banks to put up interest rates which attracts more capital inflows from global investors seeking a lucrative place to keep their money. This increases demand for the local currency, which in Canada’s case is the Canadian Dollar.

Macroeconomic data releases gauge the health of the economy and can have an impact on the Canadian Dollar. Indicators such as GDP, Manufacturing and Services PMIs, employment, and consumer sentiment surveys can all influence the direction of the CAD. A strong economy is good for the Canadian Dollar. Not only does it attract more foreign investment but it may encourage the Bank of Canada to put up interest rates, leading to a stronger currency. If economic data is weak, however, the CAD is likely to fall.

By |2025-02-11T20:42:18+05:30February 11, 2025 8:42 pm|Forex|Comments Off on USD/CAD slumps below 1.4300 as CAD capitalizes on Trump’s suspension of tariff orders

AUD/USD soars to near 0.6300 as market sentiment turns cheerful

  • AUD/USD rallies to near 0.6300 as the market sentiment becomes favorable for risk-sensitive assets.
  • The risk-appetite of investors improves on the assumption that the scope of the trade war will be limited between the US and China.
  • US-China trade war and RBA dovish bets would limit the Australian Dollar’s upside.

The AUD/USD pair surges to near the key level of 0.6300 in Wednesday’s European session. The Aussie pair strengthens as the risk appetite of investors has improved amid expectations that the trade war won’t be global and will be limited between the United States (US) and China.

S&P 500 futures are slightly down in European trading hours but have recovered their losses significantly. The US Dollar Index (DXY), which tracks the Greenback’s value against six major currencies, declines sharply to near 107.50, the lowest level in more than a week.

Market participants are anticipating a lethal trade war between the US and China as the latter has retaliated with levies of 15% on coal and LNG and 10% for crude oil, farm equipment, and some autos against US President Donald Trump’s decision to impose 10% tariffs on them.

Though a steady market environment has offered some relief to the Australian Dollar (AUD), investors expect the relief would be short-term as Australia would be the victim of the US-China trade war, being a leading trading partner of China.

Apart from that, firm market expectations that the Reserve Bank of Australia (RBA) will pivot to policy normalization from the policy meeting on February 18 would also weigh on the Australian Dollar.

In Wednesday’s session, investors will focus on the US ADP Employment Change and the ISM Services Purchasing Managers’ Index (PMI) data for January.

US-China Trade War FAQs

Generally speaking, a trade war is an economic conflict between two or more countries due to extreme protectionism on one end. It implies the creation of trade barriers, such as tariffs, which result in counter-barriers, escalating import costs, and hence the cost of living.

An economic conflict between the United States (US) and China began early in 2018, when President Donald Trump set trade barriers on China, claiming unfair commercial practices and intellectual property theft from the Asian giant. China took retaliatory action, imposing tariffs on multiple US goods, such as automobiles and soybeans. Tensions escalated until the two countries signed the US-China Phase One trade deal in January 2020. The agreement required structural reforms and other changes to China’s economic and trade regime and pretended to restore stability and trust between the two nations. However, the Coronavirus pandemic took the focus out of the conflict. Yet, it is worth mentioning that President Joe Biden, who took office after Trump, kept tariffs in place and even added some additional levies.

The return of Donald Trump to the White House as the 47th US President has sparked a fresh wave of tensions between the two countries. During the 2024 election campaign, Trump pledged to impose 60% tariffs on China once he returned to office, which he did on January 20, 2025. With Trump back, the US-China trade war is meant to resume where it was left, with tit-for-tat policies affecting the global economic landscape amid disruptions in global supply chains, resulting in a reduction in spending, particularly investment, and directly feeding into the Consumer Price Index inflation.

By |2025-02-11T20:35:25+05:30February 11, 2025 8:35 pm|Forex|Comments Off on AUD/USD soars to near 0.6300 as market sentiment turns cheerful

USD slides as trade fears ease – Scotiabank

The USD continues to retreat, leaving the DXY more than 2% below Monday’s peak, Scotiabank’s Chief FX Strategist Shaun Osborne notes.

USD trades broadly lower

“There is little fresh news to explain the US Dollar’s (USD) slide. Rather, investors are ditching long USD positions as trade war risks ease, at least for the moment. Global stocks are soft and major bond markets are firmer, with Treasurys underperforming slightly. Commodities are trading a little lower overall on the session. Generally, soft stocks, relatively firmer US yields and weak commodities would all tilt risks towards a somewhat stronger USD. But that’s not the case today.”

“This is perhaps where the preponderance of long USD positioning evident in recent data helps explain price action. Also, technical signals are leaning quite obviously bearish for the DXY on the week so far, given the scale of the sell-off, but it’s hard to buy into the idea of a sharp USD fall with trade war risks clearly still seemingly high. Beyond recent developments, President Trump has yet to confront European allies with tariffs—something that he has promised is ‘absolutely’ coming—and investors should not get too comfortable with the appearance of Trump rolling over easily after minimal concessions from Mexico and Canada won temporary reprieves.”

“More volatility seems very likely across markets in the coming weeks as the Trump team tries to reset the global trade picture. US data releases this morning include ADP jobs, final Services and Composite PMIs and the January Services ISM data. Fed speakers include Barkin, Goolsbee, Bowman and Jefferson.”

By |2025-02-11T20:32:42+05:30February 11, 2025 8:32 pm|Forex|Comments Off on USD slides as trade fears ease – Scotiabank

US ADP private sector employment rises 183,000 in January vs. 150,000 expected

•Employment in the US private sector rose at a stronger pace than expected in January.
•US Dollar Index stays deep in negative territory near 107.50.

Private sector employment in the US rose 183,000 in December and annual pay was up 4.7% year-over-year, the Automatic Data Processing (ADP) reported on Wednesday. This reading followed the 176,000 (revised from 122,000) increase recorded in December and came in above the market expectation of 150,000.

Assessing the survey’s findings, “we had a strong start to 2025 but it masked a dichotomy in the labor market,” said Nela Richardson, chief economist, ADP. “Consumer-facing industries drove hiring, while job growth was weaker in business services and production.”

Market reaction

The US Dollar Indexstruggles to stage a rebound after this data and was last seen losing 0.42% on the day at 107.55.

By |2025-02-10T16:08:17+05:30February 10, 2025 4:08 pm|Forex|Comments Off on US ADP private sector employment rises 183,000 in January vs. 150,000 expected

NZD/USD Price Forecast: Posts fresh weekly high near 0.5700

  • NZD/USD refreshes weekly high near 0.5700 as receding global trade war risks have improved the safe-haven demand.
  • The USD strives to gain ground on the back of upbeat US ADP Employment data for January.
  • The NZ economy will also face the consequences of the US-China trade war.

The NZD/USD pair posts a fresh weekly high near 0.5700 in Wednesday’s North American session. The Kiwi pair gains as the US Dollar (USD) has remained under pressure due to receding risks of a global trade war.

Investors expect the trade war to remain between the United States (US) and China as the latter has imposed tariffs on a few items from the US economy in retaliation to President Donald Trump’s decision of a 10% levy on all imports from China.

The US Dollar Index (DXY), which tracks the Greenback’s value against six major currencies, refreshes weekly low to near 107.40. However, the Greenback has got some buying interest after the release of the United States (US) ADP Employment Change data, which showed that the private sector hired 183K workers in January, higher than estimates of 150K and the prior release of 176K, revised significantly higher from 122K.

US Dollar PRICE Today

The table below shows the percentage change of US Dollar (USD) against listed major currencies today. US Dollar was the strongest against the Canadian Dollar.

USD EUR GBP JPY CAD AUD NZD CHF
USD -0.21% -0.26% -0.78% -0.19% -0.28% -0.51% -0.22%
EUR 0.21% -0.05% -0.59% 0.02% -0.06% -0.29% -0.01%
GBP 0.26% 0.05% -0.56% 0.07% -0.02% -0.25% 0.04%
JPY 0.78% 0.59% 0.56% 0.61% 0.52% 0.27% 0.57%
CAD 0.19% -0.02% -0.07% -0.61% -0.08% -0.32% -0.03%
AUD 0.28% 0.06% 0.02% -0.52% 0.08% -0.23% 0.05%
NZD 0.51% 0.29% 0.25% -0.27% 0.32% 0.23% 0.29%
CHF 0.22% 0.01% -0.04% -0.57% 0.03% -0.05% -0.29%

The heat map shows percentage changes of major currencies against each other. The base currency is picked from the left column, while the quote currency is picked from the top row. For example, if you pick the US Dollar from the left column and move along the horizontal line to the Japanese Yen, the percentage change displayed in the box will represent USD (base)/JPY (quote).

Meanwhile, the outlook of the New Zealand Dollar (NZD) remains uncertain as the impact of a trade war between the US and China will also be borne by the New Zealand economy, being one of the leading trading partners of China.

On the monetary policy front, market participants expect the Reserve Bank of New Zealand (RBNZ) to continue reducing its cash rate to reduce deepening risks of inflation undershooting their target of 2%.

NZD/USD rebounds strongly from the support zone plotted around 0.5500 on a weekly timeframe. However, the outlook of the Kiwi pair is still bearish as the 20-week Exponential Moving Average (EMA) near 0.5800 is sloping downwards.

The 14-week Relative Strength Index (RSI) attempts to return inside the 40.00-60.00 range. A fresh bearish momentum would trigger if the RSI fails to do the same.

The Kiwi pair could decline to nears round-level supports of 0.5400 and 0.5300 if it breaks below the 13-year low of 0.5470.

On the flip side, a decisive break above the November 29 high of 0.5930 could drive the pair to the November 15 high of 0.5970 and the psychological resistance of 0.6000.

NZD/USD weekly chart

By |2025-02-10T16:06:43+05:30February 10, 2025 4:06 pm|Forex|Comments Off on NZD/USD Price Forecast: Posts fresh weekly high near 0.5700

Silver Price Forecast: XAG/USD gives up gains after upbeat US ADP Employment data

  • Silver price gives up a majority of intraday gains after the release of the upbeat US private employment data for January.
  • Strong labor demand would force the Fed to maintain the status quo for longer.
  • Investors expect the trade war would be limited between the US and China.

Silver price (XAG/USD) surrenders almost its entire intraday gains and falls back to near $32.00 in Wednesday’s North American session. The white metal faces selling pressure as the US Dollar (USD) attempts to gain ground on the back of upbeat United States (US) ADP Employment Change data for January. The US Dollar Index (DXY), which tracks the Greenback’s value against six major currencies, finds buyers’ demand near 107.40 but is still over 0.4% down intraday.

The agency reported that 183K new workers were hired by the private sector last month, which were significantly higher than estimates of 150K, and the prior release of 176K, revised significantly higher from 122K.

Signs of strong labor demand would force Federal Reserve (Fed) officials to keep interest rates at their current levels for longer. Last week, Fed Chair Jerome Powell said that they will make monetary policy adjustments only after seeing “real progress in inflation or at least some weakness in labor market”. Technically, the Fed’s stance for keeping interest rates steady weighs on precious metals, such as Silver.

Meanwhile, investors are also doubting the Silver outlook amid receding fears of a lethal global trade war. Market participants expect the trade war to remain restricted between China and the US. Investors have interpreted President Donald trump’s tariff agenda as more a negotiating tool after his decision of suspending the order of imposing 25% tariffs on Canada and Mexico.

While 10% tariffs on China have come into effect from February, and in retaliation, China has also imposed levies on the US.

Silver technical analysis

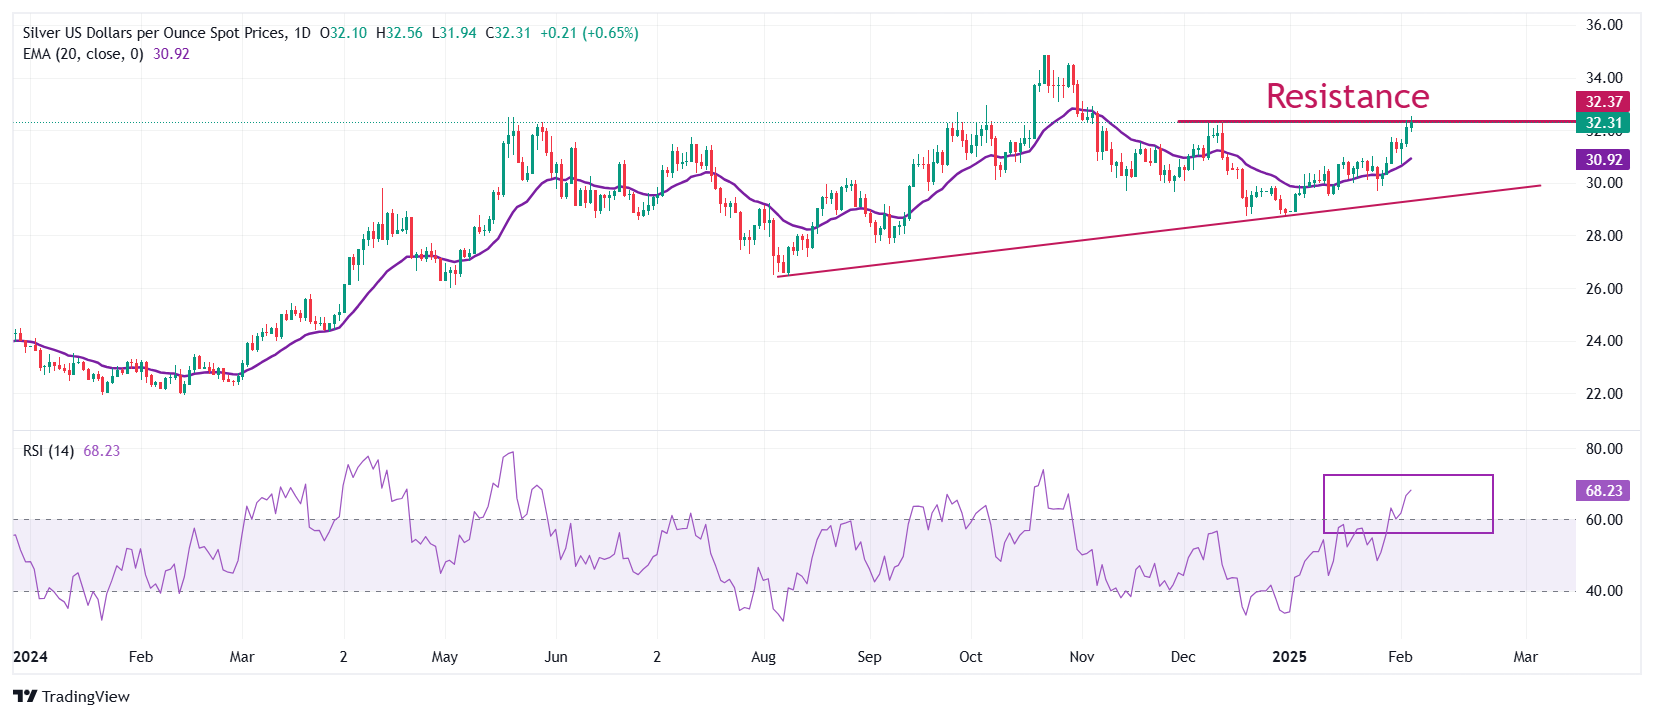
Silver price strives to break above the immediate resistance of $32.50, which is plotted from the December 9 high. The outlook of the white metal remains bullish as the 20-day Exponential Moving Average (EMA) is sloping higher near $30.90.

The 14-day Relative Strength Index (RSI) oscillates in the 60.00-80.00 range, suggesting that the momentum is bullish.

Looking down, the upward-sloping trendline from the August 8 low of $26.45 will be the key support for the Silver price around $29.50. While, the October 31 high of $33.90 will be the key barrier.

Silver daily chart

By |2025-02-10T15:58:24+05:30February 10, 2025 3:58 pm|Gold Silver|Comments Off on Silver Price Forecast: XAG/USD gives up gains after upbeat US ADP Employment data

EUR/USD Price Analysis: Pair extends gains above 20-day SMA, sustaining bullish momentum

  • EUR/USD climbs to 1.0420 on Wednesday, extending its upward trend.
  • The pair surges past the 20-day SMA, reinforcing a stronger short-term outlook.

The EUR/USD pair continued its bullish advance on Wednesday, rising by 0.39% to 1.0420 as buyers maintained control. With the latest price action, the pair has decisively climbed above the 20-day Simple Moving Average (SMA), a key resistance level that had previously limited upside attempts. This breakout signals a potential shift in sentiment, favoring further gains in the short term.

Momentum indicators align with the pair’s continued strength. The Relative Strength Index (RSI) has risen sharply to 53, signaling increased buying interest and a stronger bullish bias. Meanwhile, the Moving Average Convergence Divergence (MACD) histogram prints rising green bars, reflecting a sustained increase in momentum.

For EUR/USD to build on its recent gains, the next resistance levels to watch stand at 1.0450 and 1.0485. A break above these levels could open the door for a move toward 1.0520. On the downside, the 20-day SMA, now acting as support, is positioned near 1.0365, followed by a stronger support zone around 1.0350. Holding above the 20-day SMA will be key for the pair to sustain its positive trajectory.

EUR/USD daily chart

By |2025-02-10T15:55:12+05:30February 10, 2025 3:55 pm|Forex|Comments Off on EUR/USD Price Analysis: Pair extends gains above 20-day SMA, sustaining bullish momentum
Go to Top