About Ramya S

This author has not yet filled in any details.
So far Ramya S has created 155 blog entries.

AUD/USD holds below 0.6350 ahead of RBA rate decision

  • AUD/USD softens to around 0.6345 in Monday’s early Asian session.
  • The RBA poises to deliver the first rate cut in four years. 
  • The Aussie is benefiting from an easing of worst-case fears of US tariffs

The AUD/USD pair weakens to near 0.6345 during the early Asian session on Monday. The rising speculation of the Reserve Bank of Australia (RBA) rate cut drags the Australian Dollar (AUD) lower against the Greenback. All eyes will be on the RBA interest rate decision on Tuesday.

The Australian central bank is expected to cut its Official Cash Rate (OCR) by 25 basis points (bps) to 4.10%, the first rate reduction in four years, at the end of its two-day policy meeting on Tuesday. The RBA dovish bets are likely to weigh on the Aussie against the US Dollar (USD) for the time being.

“The prudent action for the RBA now would be to cut, but cut slowly and just see how data evolves through time. The worst thing they could possibly do is cut hard and then have to reverse. That’s the clear risk case for them,” said Craig Vardy, head of fixed income, BlackRock Australasia.

On the other hand, the downside of the AUD might be capped due to the delay in the implementation of US President Donald Trump’s tariff proposals. The process of Trump’s ultimate tariff policies might take longer than many analysts had expected. Westpac analysts are leaning toward further gains in the AUD in the near term.

Additionally, the disappointing US economic data could exert some selling pressure on the Greenback. Data released by the US Census Bureau on Friday showed that US Retail Sales declined by 0.9% in January from the 0.7% increase (revised from 0.4%) in December. This figure came in weaker than the market expectation for a decrease of 0.1%.

Australian Dollar FAQs

One of the most significant factors for the Australian Dollar (AUD) is the level of interest rates set by the Reserve Bank of Australia (RBA). Because Australia is a resource-rich country another key driver is the price of its biggest export, Iron Ore. The health of the Chinese economy, its largest trading partner, is a factor, as well as inflation in Australia, its growth rate and Trade Balance. Market sentiment – whether investors are taking on more risky assets (risk-on) or seeking safe-havens (risk-off) – is also a factor, with risk-on positive for AUD.

The Reserve Bank of Australia (RBA) influences the Australian Dollar (AUD) by setting the level of interest rates that Australian banks can lend to each other. This influences the level of interest rates in the economy as a whole. The main goal of the RBA is to maintain a stable inflation rate of 2-3% by adjusting interest rates up or down. Relatively high interest rates compared to other major central banks support the AUD, and the opposite for relatively low. The RBA can also use quantitative easing and tightening to influence credit conditions, with the former AUD-negative and the latter AUD-positive.

China is Australia’s largest trading partner so the health of the Chinese economy is a major influence on the value of the Australian Dollar (AUD). When the Chinese economy is doing well it purchases more raw materials, goods and services from Australia, lifting demand for the AUD, and pushing up its value. The opposite is the case when the Chinese economy is not growing as fast as expected. Positive or negative surprises in Chinese growth data, therefore, often have a direct impact on the Australian Dollar and its pairs.

Iron Ore is Australia’s largest export, accounting for $118 billion a year according to data from 2021, with China as its primary destination. The price of Iron Ore, therefore, can be a driver of the Australian Dollar. Generally, if the price of Iron Ore rises, AUD also goes up, as aggregate demand for the currency increases. The opposite is the case if the price of Iron Ore falls. Higher Iron Ore prices also tend to result in a greater likelihood of a positive Trade Balance for Australia, which is also positive of the AUD.

The Trade Balance, which is the difference between what a country earns from its exports versus what it pays for its imports, is another factor that can influence the value of the Australian Dollar. If Australia produces highly sought after exports, then its currency will gain in value purely from the surplus demand created from foreign buyers seeking to purchase its exports versus what it spends to purchase imports. Therefore, a positive net Trade Balance strengthens the AUD, with the opposite effect if the Trade Balance is negative.

By |2025-02-17T15:44:53+05:30February 17, 2025 3:44 pm|Forex|Comments Off on AUD/USD holds below 0.6350 ahead of RBA rate decision

Forex Today: More Fedspeak and the ADP report take centre stage

The US Dollar shed further ground on Tuesday as market participants continued to evaluate the US tariffs narrative and the potential retaliatory measures by China.

Here is what you need to know on Wednesday, February 5:

The US Dollar Index(DXY) failed to regain upside impulse, keeping the trade well above the 108.00 barrier amid tariffs concerns and higher US yields. The ADP Employment Change report will gather all the looks seconded by MBA’s Mortgage Applications, the final S&P Global Services PMI, the ISM Services PMI, and the EIA’s weekly report on US crude oil stockpiles. In addition, the Fed’s Jefferson, Barkin, Goolsbee, and Bowman are all due to speak.

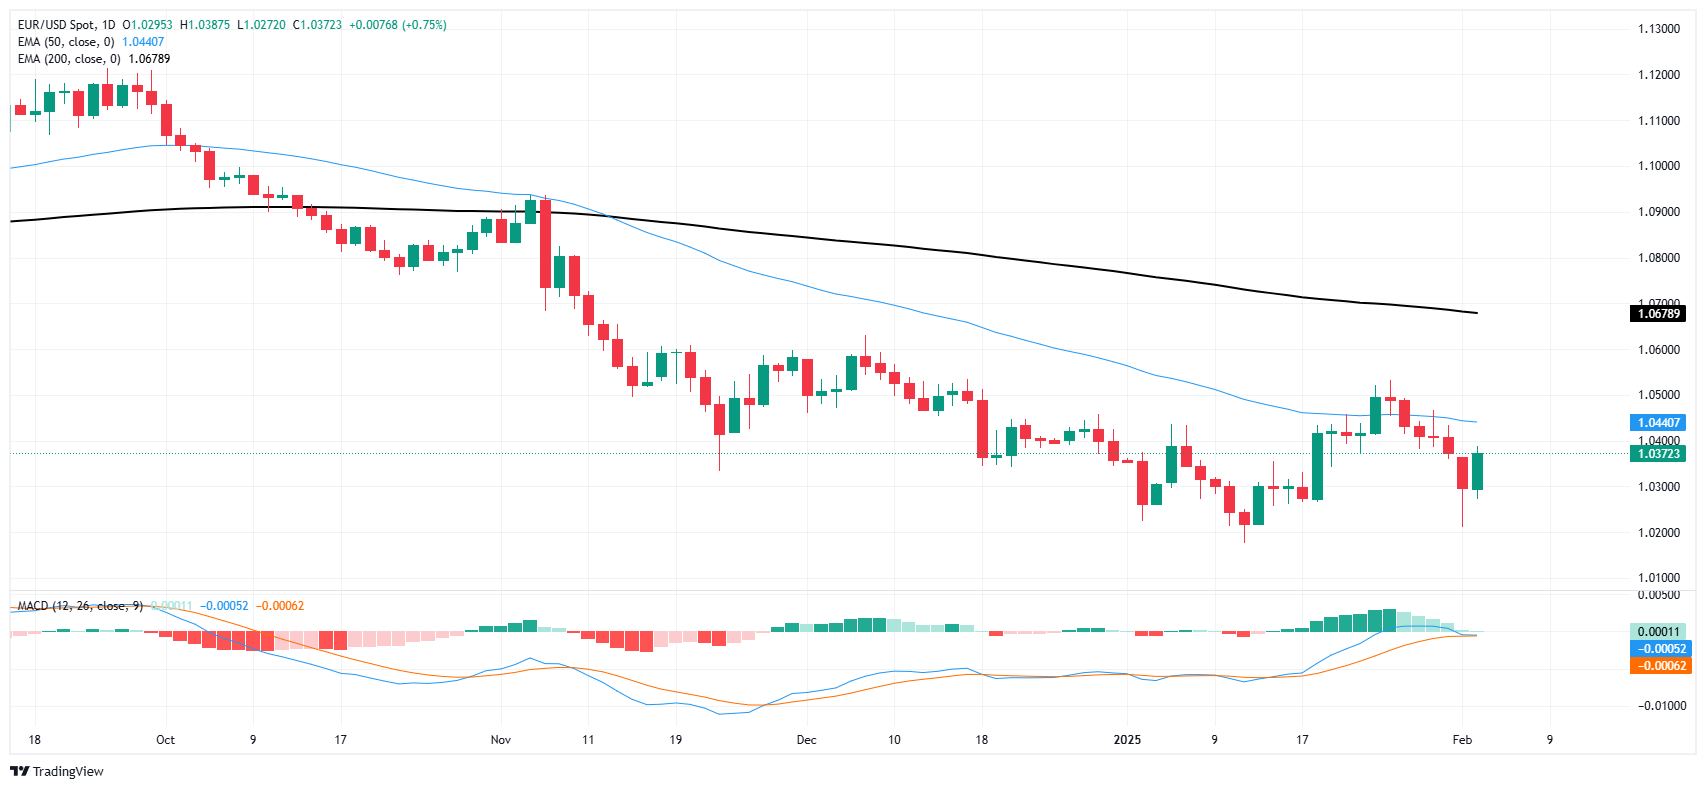
EUR/USD picked up a strong pace and reversed six days of losses, advancing to the vicinity of the key 1.0400 mark on Tuesday. The final HCOB Services PMIs in Germany and the euro area are due, seconded by Producer Prices in the bloc and the speech by the ECB’s Lane.

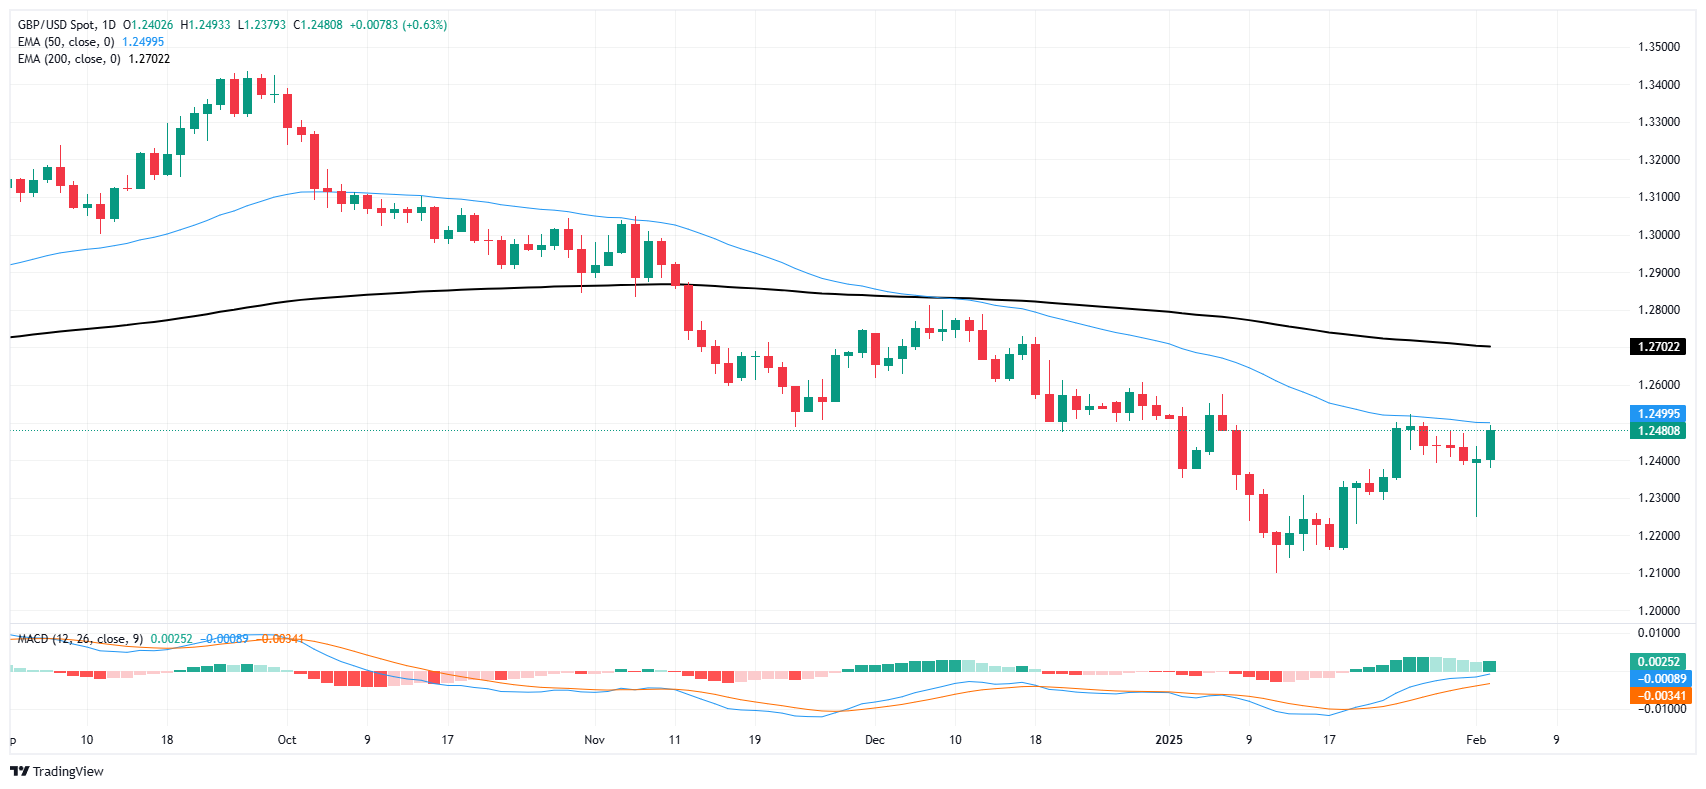
GBP/USDadded to Monday’s advance and revisited the boundaries of the key 1.2500 barrier on the back of the persistent offered bias in the Greenback. All the attention will be on the publication of the final S&P Global Services PMI.

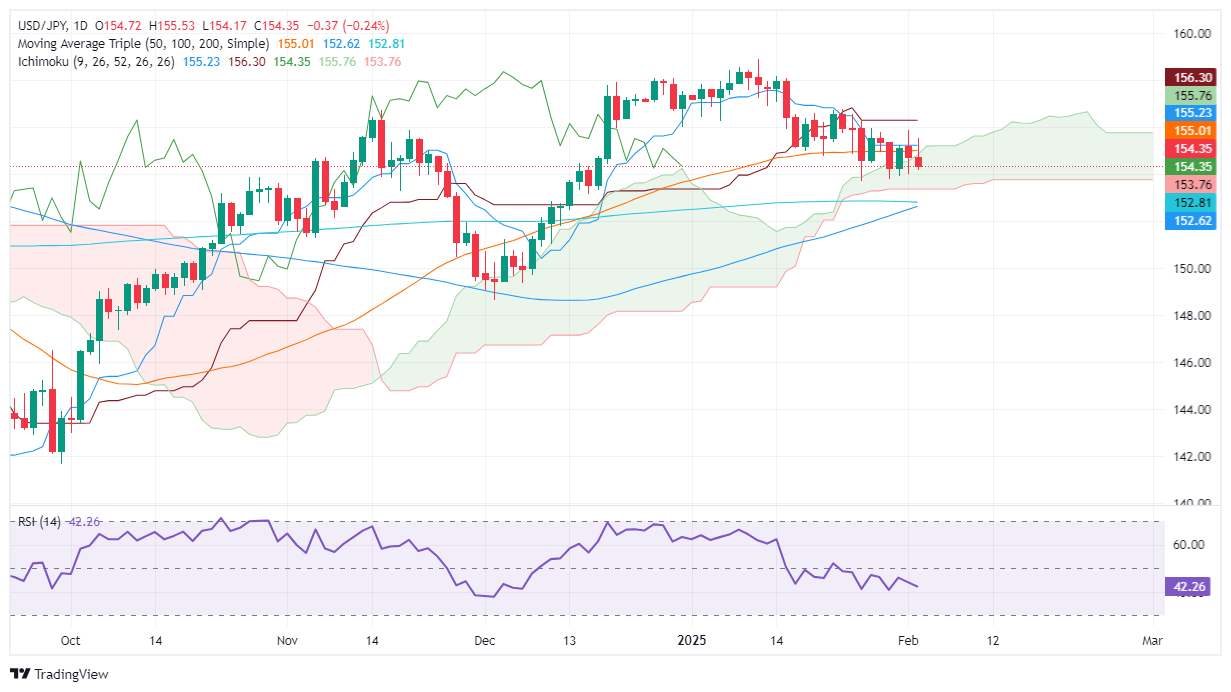
USD/JPY kept the erratic performance well in place, reversing Monday’s retracement and revisiting the 155.50 zone. The final Jibun Bank Services PMI and Average Cash Earnings will be released.

AUD/USD rebounded from Monday’s multi-year lows. Although it failed to extend the bounce further north of the 0.6260 region, it printed marked gains for the day. The Ai Group Manufacturing Index is next on tap in Oz.

WTI prices managed to stage a marked comeback after hitting new lows near the $70.00 mark per barrel, eventually ending the day with humble gains.

Gold prices rose to an all-time high around $2,840 per ounce troy amid the Dollar’s pullback and steady jitters surrounding Trump’s tariffs plan. Silver prices gathered extra steam and surpassed the $32.00 level per ounce for the first time since mid-December.

By |2025-02-17T15:35:18+05:30February 17, 2025 3:35 pm|Forex|Comments Off on Forex Today: More Fedspeak and the ADP report take centre stage

Australian Dollar edges higher amid delayed tariffs and soft US data

  • AUD/USD advanced to 0.6255 on Tuesday, extending Monday’s rebound.
  • China announced tariffs on specific US goods.
  • Market sentiment improves on expectations of softer US data and potential RBA easing.

On Tuesday, the AUD/USD rose to 0.6255 as the pair extended Monday’s comeback. The recovery comes after renewed US tariffs on China prompted by President Trump followed delays in tariffs on Canada and Mexico, the latter of which have eased trade war fears.

Meanwhile, aggressive bets on a February Royal Bank of Australia (RBA) rate cut and concerns over China’s economic slowdown continue to weigh on the AUD.

Daily digest market movers: Aussie up as China imposes tariffs on US

  • President Trump first announced a 25% duty on goods from Canada and Mexico but then agreed to postpone these tariffs for a month, easing immediate trade tensions. In tandem, a 10% tariff on Chinese imports remains in effect, while China has signaled it will contest these measures at the WTO.
  • The US Dollar experienced volatility after a brief rally that pushed the Dollar Index toward three-week highs near 110.00 and then fell toward 108.00.
  • On the data front, JOLTS Job Openings fell to 7.6 million in December, missing the 8 million consensus estimate.
  • On the home front, Australian CPI data for December is anticipated to show subdued inflation, forecast at around 2.5% YoY compared to 2.8% previously, which has bolstered market bets on a 25 bps RBA rate cut in February.
  • However, persistent concerns over China’s weak recovery and sluggish domestic economic momentum continue to weigh on the Aussie.
  • Broader market risk sentiment remains cautious following recent volatility in global equity and bond markets, while renewed geopolitical concerns and technology sector sell-offs have also added safe-haven demand for the US Dollar.

AUD/USD technical outlook: Bulls step on the gas, outlook improves

The AUD/USD pair edged up to 0.6255 on Tuesday as it navigated within a narrow trading range between 0.6200 and 0.6300. The Relative Strength Index (RSI) is at 53, positioned in positive territory and rising sharply, which signals growing buying interest.

Simultaneously, the Moving Average Convergence Divergence (MACD) histogram displays green bars, suggesting that while bullish momentum is emerging, it is still tempered by prevailing market uncertainties. With support firmly established near 0.6200 and resistance around 0.6300, a break either way will dictate the pace of the pair.


Australian Dollar FAQs

One of the most significant factors for the Australian Dollar (AUD) is the level of interest rates set by the Reserve Bank of Australia (RBA). Because Australia is a resource-rich country another key driver is the price of its biggest export, Iron Ore. The health of the Chinese economy, its largest trading partner, is a factor, as well as inflation in Australia, its growth rate and Trade Balance. Market sentiment – whether investors are taking on more risky assets (risk-on) or seeking safe-havens (risk-off) – is also a factor, with risk-on positive for AUD.

The Reserve Bank of Australia (RBA) influences the Australian Dollar (AUD) by setting the level of interest rates that Australian banks can lend to each other. This influences the level of interest rates in the economy as a whole. The main goal of the RBA is to maintain a stable inflation rate of 2-3% by adjusting interest rates up or down. Relatively high interest rates compared to other major central banks support the AUD, and the opposite for relatively low. The RBA can also use quantitative easing and tightening to influence credit conditions, with the former AUD-negative and the latter AUD-positive.

China is Australia’s largest trading partner so the health of the Chinese economy is a major influence on the value of the Australian Dollar (AUD). When the Chinese economy is doing well it purchases more raw materials, goods and services from Australia, lifting demand for the AUD, and pushing up its value. The opposite is the case when the Chinese economy is not growing as fast as expected. Positive or negative surprises in Chinese growth data, therefore, often have a direct impact on the Australian Dollar and its pairs.

Iron Ore is Australia’s largest export, accounting for $118 billion a year according to data from 2021, with China as its primary destination. The price of Iron Ore, therefore, can be a driver of the Australian Dollar. Generally, if the price of Iron Ore rises, AUD also goes up, as aggregate demand for the currency increases. The opposite is the case if the price of Iron Ore falls. Higher Iron Ore prices also tend to result in a greater likelihood of a positive Trade Balance for Australia, which is also positive of the AUD.

The Trade Balance, which is the difference between what a country earns from its exports versus what it pays for its imports, is another factor that can influence the value of the Australian Dollar. If Australia produces highly sought after exports, then its currency will gain in value purely from the surplus demand created from foreign buyers seeking to purchase its exports versus what it spends to purchase imports. Therefore, a positive net Trade Balance strengthens the AUD, with the opposite effect if the Trade Balance is negative.
By |2025-02-17T15:33:54+05:30February 17, 2025 3:33 pm|Forex|Comments Off on Australian Dollar edges higher amid delayed tariffs and soft US data

NZD/USD Price Analysis: Kiwi climbs above 20-day SMA, signaling renewed momentum

  • NZD/USD advances to 0.5650 on Tuesday, extending recent gains.
  • The pair breaks above the 20-day SMA, reinforcing bullish sentiment.
  • An overall bullish trend wouldbe confirmed if it breaks above 0.5800.

The NZD/USD pair continued its upward trajectory on Tuesday, rising 0.39% to 0.5650 and breaking above its 20-day Simple Moving Average (SMA). This move suggests a potential shift in sentiment, with buyers gaining control after a prolonged period of range-bound movement. The breakout above this technical level could pave the way for further gains in the near term so the pair should focus in building support around this area to secure it.

From a technical perspective, indicators point to growing bullish momentum. The Relative Strength Index (RSI) has climbed to 50, confirming increasing buying pressure, while the Moving Average Convergence Divergence (MACD) histogram prints rising green bars, reinforcing the improving outlook.

Looking ahead, if NZD/USD manages to hold above the 20-day SMA, the next resistance levels to watch are at 0.5680 and 0.5725. On the downside, immediate support lies at 0.5620, with a break below this level potentially leading to a retest of 0.5585. Maintaining a position above the 20-day SMA will be crucial for sustaining the current bullish bias.

NZD/USD daily chart

By |2025-02-17T15:31:27+05:30February 17, 2025 3:31 pm|Forex|Comments Off on NZD/USD Price Analysis: Kiwi climbs above 20-day SMA, signaling renewed momentum

USD/JPY Price Analysis: Retreats below 155.00 on trade war tensions

  • USD/JPY faces continued pressure, potentially closing below 155.00 as US-China trade war escalates.
  • Technical indicators suggest further downside, with pair now trading within the Ichimoku Cloud.
  • Resistance and support levels closely watched, with potential rebounds facing hurdles at 155.76 and 156.29.

The USD/JPY drops below 155.00 for the second straight day and seems poised to achieve a daily close below the latter. Falling US Treasury yields and the escalation of the “trade war” between the United States (US) and China would underpin the Japanese Yen (JPY) due to its safe-haven appeal. At the time of writing, the pair posts losses of 0.28%.

USD/JPY Price Analysis: Technical outlook

Developments over the weekend developed a huge 190-pipe candle on February 3, which lately closed below 155.00 for the first time since January 30. Additionally, the USD/JPY pair cleared the 50-day Simple Moving Average (SMA) at 155.02 and registered back-to-back bearish close days, which could pave the way for further downside.

Of note is that the USD/JPY spot price lies inside the Ichimoku Cloud (Kumo), which indicates “sideways price action.”

If USD/JPY edged below the January 30 low of 153.79, this could open the door to challenge the Senkou Span B at 153.76, followed by the January 27 low of 153.71. If those levels are cleared, the next support would be the 200-day SMA at 152.81.

Conversely, if USD/JPY climbs above the 50-day SMA, the next resistance would be the Senkou Span A at 155.76, ahead of challenging the Tenkan-Sen at 156.29

USD/JPY Price Chart

By |2025-02-17T15:30:13+05:30February 17, 2025 3:30 pm|Forex|Comments Off on USD/JPY Price Analysis: Retreats below 155.00 on trade war tensions

GBP/USD extends recovery but remains on shaky ground

  • GBP/USD climbed 0.6% on Tuesday as tariff threats ease.
  • President Trump’s trade war threats are fading into the background.
  • Data remains mid-tier until BoE’s rate call on Thursday and Friday’s US NFP.

GBP/USD continued to grind higher on Tuesday, extending a recovery after the week’s early plunge on trade war concerns sparked by US President Donald Trump’s sweeping threats to impose stiff tariffs on his own constituents in an effort to punish some of the US’ closest trade allies. Tariffs, which were supposed to go into effect on Tuesday, have been kicked down the road another 30 days, marking President Trump’s third consecutive walk back of his own threats as he secures concessions that were largely already given to the previous administration.

The midweek session will be a thin affair on the economic data docket with geopolitical headlines fading into background noise as investors tune out President Trump’s long-winded diatribe of perceived grievances. Even if his tariff talk had a chance of materializing, the UK is unlikely to draw any specific trade ire from Donald Trump.

US ADP Employment Change figures are due on Wednesday, but the janky figure is unlikely to spark much momentum. US ISM Services Purchasing Managers Index (PMI) activity survey results for January are also expected, but the figure is forecast to shift to 54.3 from 54.1. The key US print this week will be Friday’s Nonfarm Payrolls, slated to ease to 170K from 256K.

The Bank of England’s (BoE) upcoming rate call on Thursday is broadly expected to deliver a quarter point cut to markets. With the US Federal Reserve (Fed) firmly embedded in a wait-and-see stance over inconsistent US policy, Cable’s interest rate differential is set to widen slightly this week, capping bullish potential.

GBP/USD price forecast

GBP/USD climbed a little over six-tenths of one percent, clawing back to 1.2480, but the pair still remains capped below the 1.2500 handle as the 50-day Exponential Moving Average (EMA) weighs on near-term price action.

A successful break to the upside could send Cable bids back into the 200-day EMA at 1.2700, but a return to recent lows near 1.2100 is also on the cards as price action wastes a bullish turnaround in the Moving Average Convergence-Divergence (MACD) oscillator.

GBP/USD daily chart

By |2025-02-17T15:29:05+05:30February 17, 2025 3:29 pm|Forex|Comments Off on GBP/USD extends recovery but remains on shaky ground

EUR/USD bounces as market pressures abate

  • EUR/USD gained 0.8% on Tuesday as trade wars turn hypothetical.
  • President Trump’s tariff bluffs have been called by the markets after several delays.
  • European economic data remains thin this week.

EUR/USD lurched higher by eight-tenths of one percent on Tuesday, regaining lost ground but failing to recapture the 1.0400 handle. Fiber has snapped a six-day losing streak, but overall bullish momentum remains thin with the Euro at the mercy of overall market flows and looming US Nonfarm Payrolls (NFP) figures.

EUR/USD’s early-week plunge toward 1.0200 sparked by impending tariffs from US President Donald Trump has firmly recovered ground after the Trump administration took any excuse it could find to avert its self-imposed threats to tax its own citizens for importing goods from other countries. Threats of a flat 10% import tax on European-produced goods are still on the cards, but last-minute pivots into concessions on nearly all of President Trump’s targeted countries, except for China, has left investors confident that the posturing is simply that and nothing more. 10% import fees on goods from China are still on the table, but President Trump also failed to follow through on his threat to arbitrarily double tariffs on any countries that retaliate.

To his credit, China’s retaliatory tariffs of 10% on US-made goods is a largely theatrical gesture; very few US-made goods make it overseas to Chinese markets, and the move is mostly symbolic. Investors are now tuning out most of President Trump’s trade rhetoric as the US administration fumbles its own setup, and future tariff threats are likely to have muted impacts as future concessions get priced in ahead of time.

The US ADP Employment Change data is set to be released on Wednesday; however, this erratic figure is not expected to generate significant movement. Additionally, the US ISM Services Purchasing Managers Index (PMI) report for January is anticipated, with projections indicating a rise from 54.1 to 54.3. The most critical US data point this week will be Friday’s Nonfarm Payrolls, which is predicted to decline from 256K to 170K.

EUR/USD price forecast

EUR/USD found enough juice to halt a six-day backslide, but the pair still remains on the wrong side of the 1.0400 handle and the 50-day Exponential Moving Average (EMA) at 1.0440. Bullish momentum has waned out of technical oscillators, and Fiber price action is set for a sideways grind between 1.0500 and 1.0300.

EUR/USD daily chart

By |2025-02-17T15:27:05+05:30February 17, 2025 3:27 pm|Forex|Comments Off on EUR/USD bounces as market pressures abate

Australian Dollar edges lower amid rising fears over US-China trade war

  • The Australian Dollar struggles as risk-off sentiment intensifies due to escalating US-China trade tensions.
  • Australia’s Judo Bank Composite PMI rose to 51.1 in January from 50.2 in December, signaling a modest expansion.
  • Fed’s Daly stated that the central bank remains in a wait-and-see stance, emphasizing the impact of economic uncertainty on policymaking.

The Australian Dollar (AUD) edges lower against the US Dollar (USD) amid an increased risk aversion following rising fears over US-China trade tensions. The AUD/USD pair failed to draw support from the improved Judo Bank Purchasing Managers Index (PMI) released on Wednesday.

Australia’s Judo Bank Composite PMI climbed to 51.1 in January from 50.2 in December, reflecting modest growth in private sector activity. Meanwhile, the Judo Bank Services PMI rose to 51.2 from 50.8, marking the twelfth consecutive month of expansion in the services sector. Although the growth was moderate, it was the strongest since August.

The AUD may further depreciate amid the increased likelihood that the Reserve Bank of Australia (RBA) could consider a rate cut in February. The RBA has maintained the Official Cash Rate (OCR) at 4.35% since November 2023, emphasizing that inflation must “sustainably” return to its 2%-3% target range before any policy easing.

The Aussie Dollar faces challenges as market volatility remains a concern as investors closely watch the ongoing trade war between the United States (US) and China, Australia’s key trading partner. China retaliated against the new 10% US tariff that took effect on Tuesday. However, Trump stated on Monday afternoon that he would likely speak with China within the next 24 hours. He also warned, “If we can’t reach a deal with China, the tariffs will be very, very substantial.”

Australian Dollar remains under pressure amid increased risk aversion

  • The US Dollar Index (DXY), which measures the US Dollar’s value against six major currencies, remains under downward pressure for the third successive day, trading around 108.00 at the time of writing. Meanwhile, traders brace for Friday’s US Nonfarm Payrolls (NFP) data, which is expected to shape the Federal Reserve’s (Fed) monetary policy direction.
  • President Trump has agreed to a 30-day suspension of the proposed 25% tariffs on Canadian and Mexican imports. This decision comes after Canadian Prime Minister Justin Trudeau and Mexican President Claudia Sheinbaum committed to enhancing border security measures to address concerns over illegal immigration and drug trafficking.
  • China’s Commerce Ministry announced that it will impose a 15% tariff on US coal and liquefied natural gas (LNG) imports, along with an additional 10% tariff on crude Oil, farm equipment, and certain automobiles. Additionally, to “safeguard national security interests,” China is implementing export controls on tungsten, tellurium, ruthenium, molybdenum, and related products.
  • According to the Financial Times, Chinese exporters are intensifying their efforts to offshore production in response to Trump’s tariffs. Manufacturers in China are accelerating plans to relocate production to other countries, including the Middle East, to avoid US tariffs. Other tactics being considered include passing the increased costs onto US consumers and exploring alternative markets.
  • The White House announced late Monday that US President Donald Trump signed an executive order to initiate the creation of a government-owned investment fund, according to Reuters. This fund could allow the US to profit from TikTok if an American buyer is secured. TikTok has until early April to find an approved partner or purchaser. Trump is pushing for the US to acquire a 50% stake in the company.
  • JOLTS Job Openings fell to 7.6 million in December, missing the 8 million consensus estimate. The US labor market remains stable with total separations little changed at 5.3 million in December.
  • The CME FedWatch Tool projects an 86% chance that the Fed will keep rates unchanged at its March meeting.
  • San Francisco Fed Bank President Mary Daly stated on Tuesday that the central bank remains in a wait-and-see stance, emphasizing the impact of economic uncertainty on policymaking. While the economy is performing well and maintaining momentum, uncertainty persists. As a result, the Fed has the flexibility to carefully assess data before making policy adjustments.

Technical Analysis: Australian Dollar breaks above nine-day EMA and descending channel

The AUD/USD pair trades near 0.6250 on Wednesday, staying above the descending channel pattern on the daily chart, indicating a potential bullish shift. The 14-day Relative Strength Index (RSI) sits at the 50 level, reflecting neutral momentum. A sustained break above 50 on the RSI could confirm a stronger bullish trend.

On the upside, the AUD/USD pair could explore the area around its seven-week high at 0.6330 level, which was recorded on January 24.

The AUD/USD pair may find immediate support at the nine-day Exponential Moving Average (EMA) near 0.6240, followed by the upper boundary of the descending channel. A pullback to the channel would reinforce the bearish bias, potentially driving the pair toward the lower boundary of the descending channel around 0.6140.

AUD/USD: Daily Chart

By |2025-02-17T15:25:54+05:30February 17, 2025 3:25 pm|Forex|Comments Off on Australian Dollar edges lower amid rising fears over US-China trade war

NZD/USD hovers around 0.5650 following labor market, China’s PMI

  • NZD/USD remains silent following the release of domestic employment figures on Wednesday.
  • China’s Services PMI dropped to 51.0 in January from 52.2 in December, falling short of the expected 52.3.
  • Traders anticipate Friday’s US Nonfarm Payrolls (NFP), which is expected to show a slight slowdown in job growth for January.

NZD/USD remains steady following the release of the Caixin Services Purchasing Managers’ Index (PMI) from China, New Zealand’s close trading partner. The New Zealand Dollar (NZD) also avoided to react on the domestic labor market data. The pair trades around 0.5650 during the Asian hours on Wednesday.

China’s Services PMI unexpectedly fell to 51.0 in January from 52.2 in December. The data surprised to the downside, missing the estimated 52.3 figure.

New Zealand’s Unemployment Rate climbed to 5.1% in Q4 2024, up from 4.8% in the previous period, in line with market expectations and reaching its highest level since September 2020. The Employment Rate edged down to 67.4% from 67.7%, while the underutilization rate increased slightly to 12.1% from 11.6% in the previous quarter.

The New Zealand Dollar (NZD) could struggle due to a risk-off sentiment following rising fears over US-China trade tensions. China retaliated against the new 10% US tariff that took effect on Tuesday. However, Trump stated on Monday afternoon that he would likely speak with China. He also warned, “If we can’t reach a deal with China, the tariffs will be very, very substantial.” However, no further update is available.

China’s Commerce Ministry announced that it will impose a 15% tariff on US coal and liquefied natural gas (LNG) imports, along with an additional 10% tariff on crude Oil, farm equipment, and certain automobiles. Additionally, to “safeguard national security interests,” China is implementing export controls on tungsten, tellurium, ruthenium, molybdenum, and related products.

The US Dollar Index (DXY), which measures the US Dollar’s value against six major currencies, remains under downward pressure for the third successive day, trading around 108.00 at the time of writing. Meanwhile, traders brace for Friday’s US Nonfarm Payrolls (NFP) data, which is expected to shape the Federal Reserve’s (Fed) monetary policy direction.

Economic Indicator

Caixin Services PMI

The Caixin Services Purchasing Managers Index (PMI), released on a monthly basis by Caixin Insight Group and S&P Global, is a leading indicator gauging business activity in China’s services sector. The data is derived from surveys of senior executives at both private-sector and state-owned companies. Survey responses reflect the change, if any, in the current month compared to the previous month and can anticipate changing trends in official data series such as Gross Domestic Product (GDP), industrial production, employment and inflation. The index varies between 0 and 100, with levels of 50.0 signaling no change over the previous month. A reading above 50 indicates that the services economy is generally expanding, a bullish sign for the Renminbi (CNY). Meanwhile, a reading below 50 signals that activity among service providers is generally declining, which is seen as bearish for CNY.

Read more.

Last release: Wed Feb 05, 2025 01:45

Frequency: Monthly

Actual: 51

Consensus: 52.3

Previous: 52.2

Source: IHS Markit

By |2025-02-17T15:24:22+05:30February 17, 2025 3:24 pm|Forex|Comments Off on NZD/USD hovers around 0.5650 following labor market, China’s PMI

USD/CAD consolidates above 1.4300 mark; upside potential seems limited

  • USD/CAD struggles to gain any meaningful traction and hangs near a two-week trough. 
  • Subdued Oil prices and the BoC’s dovish outlook undermine the Loonie and cap the pair. 
  • The USD languishes near the weekly low and further acts as a headwind for spot prices.

The USD/CAD pair enters a bearish consolidation phase after registering heavy losses over the past two days and holds above the 1.4300 mark during the Asian session on Wednesday. Moreover, the fundamental backdrop warrants some caution before confirming that a sharp pullback from a two-decade high touched on Monday has run its course.

Crude Oil prices struggle to capitalize on the overnight bounce from the year-to-date (YTD) low amid US-China trade tensions. This, along with the Bank of Canada’s (BoC) dovish outlook, undermines the commodity-linked Loonie and acts as a tailwind for the USD/CAD pair. That said, a weaker US Dollar (USD) is holding back traders from placing aggressive bullish bets around the currency pair.

In fact, the USD Index (DXY), which tracks the Greenback against a basket of currencies, languishes near the weekly low amid expectations that the Federal Reserve (Fed) will lower borrowing costs further by the end of this year. The bets were reaffirmed by the Job Openings and Labor Turnover Survey (JOLTS) released on Tuesday, which pointed to a slowdown in the US labor market.

Apart from this, US President Donald Trump’s decision to delay the 25% trade tariffs on Canadian and Mexican imports by 30 days contributes to capping the USD/CAD pair. Traders now look forward to the US economic docket – featuring the release of the ADP report on private-sector employment and the ISM Services PMI. This, along with Oil price dynamics, should provide some impetus to spot prices.

Canadian Dollar FAQs

The key factors driving the Canadian Dollar (CAD) are the level of interest rates set by the Bank of Canada (BoC), the price of Oil, Canada’s largest export, the health of its economy, inflation and the Trade Balance, which is the difference between the value of Canada’s exports versus its imports. Other factors include market sentiment – whether investors are taking on more risky assets (risk-on) or seeking safe-havens (risk-off) – with risk-on being CAD-positive. As its largest trading partner, the health of the US economy is also a key factor influencing the Canadian Dollar.

The Bank of Canada (BoC) has a significant influence on the Canadian Dollar by setting the level of interest rates that banks can lend to one another. This influences the level of interest rates for everyone. The main goal of the BoC is to maintain inflation at 1-3% by adjusting interest rates up or down. Relatively higher interest rates tend to be positive for the CAD. The Bank of Canada can also use quantitative easing and tightening to influence credit conditions, with the former CAD-negative and the latter CAD-positive.

The price of Oil is a key factor impacting the value of the Canadian Dollar. Petroleum is Canada’s biggest export, so Oil price tends to have an immediate impact on the CAD value. Generally, if Oil price rises CAD also goes up, as aggregate demand for the currency increases. The opposite is the case if the price of Oil falls. Higher Oil prices also tend to result in a greater likelihood of a positive Trade Balance, which is also supportive of the CAD.

While inflation had always traditionally been thought of as a negative factor for a currency since it lowers the value of money, the opposite has actually been the case in modern times with the relaxation of cross-border capital controls. Higher inflation tends to lead central banks to put up interest rates which attracts more capital inflows from global investors seeking a lucrative place to keep their money. This increases demand for the local currency, which in Canada’s case is the Canadian Dollar.

Macroeconomic data releases gauge the health of the economy and can have an impact on the Canadian Dollar. Indicators such as GDP, Manufacturing and Services PMIs, employment, and consumer sentiment surveys can all influence the direction of the CAD. A strong economy is good for the Canadian Dollar. Not only does it attract more foreign investment but it may encourage the Bank of Canada to put up interest rates, leading to a stronger currency. If economic data is weak, however, the CAD is likely to fall.

Tariffs FAQs

Tariffs are customs duties levied on certain merchandise imports or a category of products. Tariffs are designed to help local producers and manufacturers be more competitive in the market by providing a price advantage over similar goods that can be imported. Tariffs are widely used as tools of protectionism, along with trade barriers and import quotas.

Although tariffs and taxes both generate government revenue to fund public goods and services, they have several distinctions. Tariffs are prepaid at the port of entry, while taxes are paid at the time of purchase. Taxes are imposed on individual taxpayers and businesses, while tariffs are paid by importers.

There are two schools of thought among economists regarding the usage of tariffs. While some argue that tariffs are necessary to protect domestic industries and address trade imbalances, others see them as a harmful tool that could potentially drive prices higher over the long term and lead to a damaging trade war by encouraging tit-for-tat tariffs.

During the run-up to the presidential election in November 2024, Donald Trump made it clear that he intends to use tariffs to support the US economy and American producers. In 2024, Mexico, China and Canada accounted for 42% of total US imports. In this period, Mexico stood out as the top exporter with $466.6 billion, according to the US Census Bureau. Hence, Trump wants to focus on these three nations when imposing tariffs. He also plans to use the revenue generated through tariffs to lower personal income taxes.

By |2025-02-17T15:23:15+05:30February 17, 2025 3:23 pm|Forex|Comments Off on USD/CAD consolidates above 1.4300 mark; upside potential seems limited
Go to Top