About Ramya S

This author has not yet filled in any details.
So far Ramya S has created 155 blog entries.

GBP/USD pulls back after BoE rate cut

  • GBP/USD briefly tumbled back below 1.2400 after the BoE cut rates again.
  • Despite the rate cut, BoE tones struck a hawkish chord, crimping further bets.
  • US NFP Friday looms large ahead to cap off the trading week.

GBP/USD shuddered on Thursday, punching in a technical rejection from key averages and testing below the 1.2400 handle. The Bank of England (BoE) trimmed interest rates by another 25 bps, but struck a hawkish tone that saw rate markets tune down their bets of further rate cuts through the remainder of 2025.

According to rate markets, the BoE will likely make another two or three rate cuts through the year. All nine members of the Monetary Policy Committee (MPC) voted for a rate cut, with seven voting for a 25 bps rate trim and two particularly-dovish members voting for a double-cut for 50 bps. Despite the accelerated eagerness of policymakers to deliver a February rate cut, markets only expect another 70 or so basis points to be taken off the BoE’s reference rate this year.

Another Nonfarm Payrolls (NFP) jobs data dump looms on Friday. Net job additions are expected to ease to 170K in January, down from December’s print of 256K. Revisions to older data will be closely watched this week. Post-print revisions drifted toward the stronger side during 2024, frustrating market participants hoping for cracks in the US employment landscape to help push the Federal Reserve (Fed) toward more rate cuts.

GBP/USD price forecast

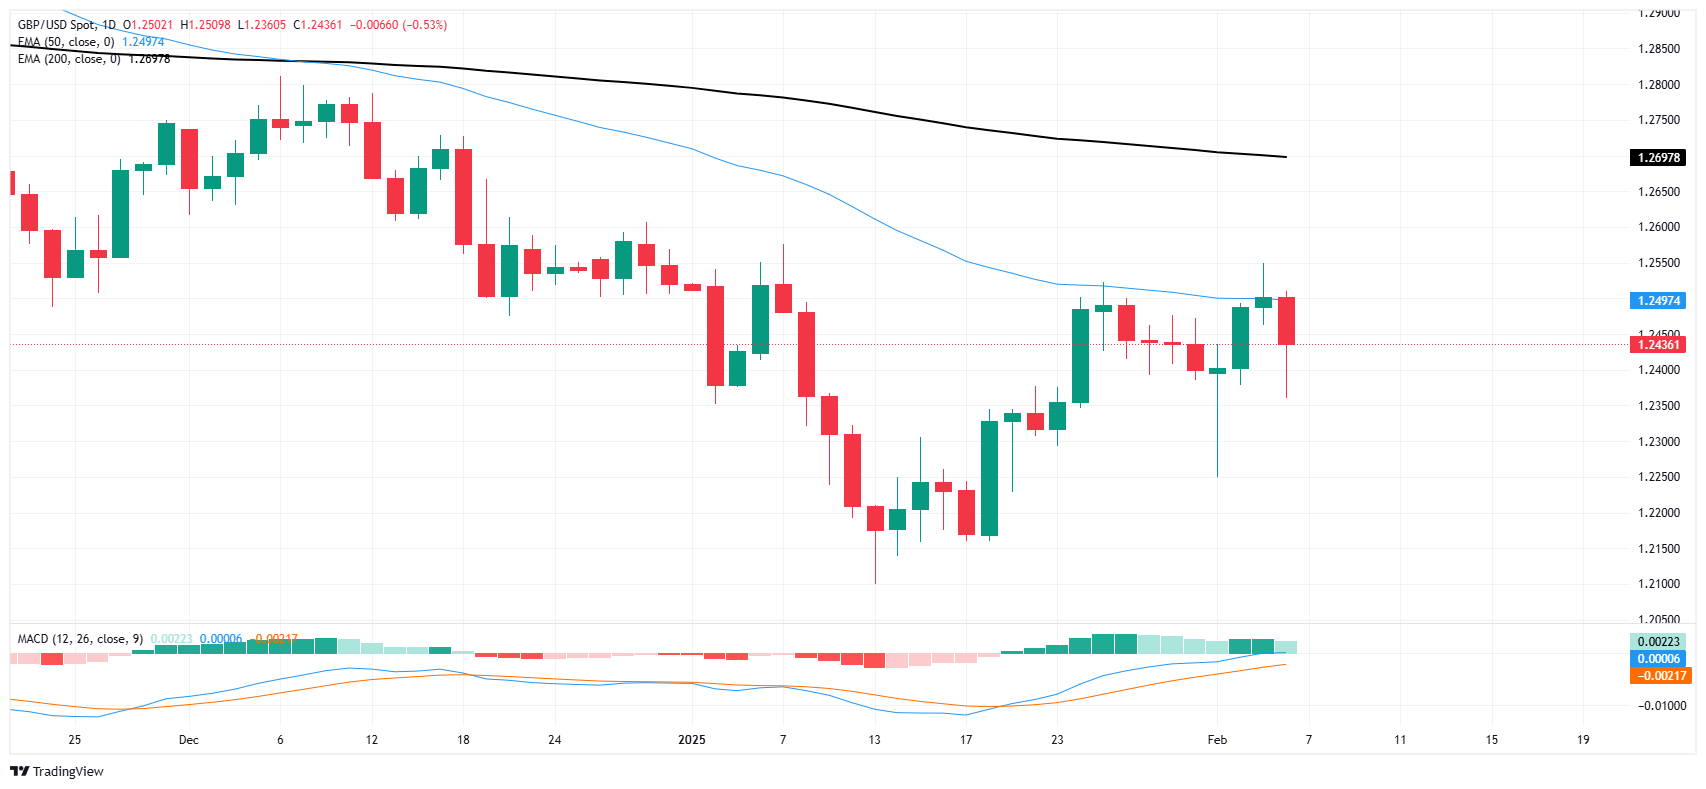
Thursday’s bearish pullback saw GBP/USD price in a technical rejection of the 50-day Exponential Moving Average (EMA), touching an intraday low near 1.2350. The pair settled the day a little south of 1.2450, but further bearish momentum could be on the cards as bulls struggle to sustain momentum.

GBP/USD daily chart

By |2025-02-10T06:25:50+05:30February 10, 2025 6:25 am|Forex|Comments Off on GBP/USD pulls back after BoE rate cut

WTI extends downside below $70.50 as US-China trade war intensifies

  • WTI price extends its decline to around $70.35 in Friday’s early Asian session.
  • Worries about US-China trade tensions continue to undermine the WTI price. 
  • Escalating Middle East geopolitical tensions might cap the downside for the black gold. 

West Texas Intermediate (WTI), the US crude oil benchmark, is trading around $70.35 during the early Asian session on Friday. The WTI price edges lower amid concerns of weakening demands after China announced a retaliatory tariff on US crude oil imports, while the US inventory rose for the second consecutive week.

The renewed US-China trade war could weigh on the WTI price. Investors are increasingly worried about a slowing global economy and weakening energy demand in China, the world’s top oil importer. On Tuesday, China’s finance ministry announced a package of tariffs on a range of US products, including crude oil, farm equipment, and some autos in an immediate response to a 10% tariff on Chinese imports announced by US President Donald Trump.

The US reported a much bigger-than-anticipated jump in crude stockpiles last week, signaling weaker demand. The US Energy Information Administration (EIA) weekly report showed crude oil stockpiles in the United States for the week ending January 31 jumped by 8.664 million barrels, compared to a rise of 3.463 million barrels in the previous week. The market consensus estimated that stocks would increase by 3.2 million barrels.

On the other hand, the rising geopolitical tensions in the Middle East could provide some support to the WTI price. Trump has proposed seizing control of Gaza, which might exacerbate regional tensions. He is also anticipated to tighten sanctions on Iran, having expressed his desire to reduce Tehran’s oil exports to zero.

WTI Oil FAQs

WTI Oil is a type of Crude Oil sold on international markets. The WTI stands for West Texas Intermediate, one of three major types including Brent and Dubai Crude. WTI is also referred to as “light” and “sweet” because of its relatively low gravity and sulfur content respectively. It is considered a high quality Oil that is easily refined. It is sourced in the United States and distributed via the Cushing hub, which is considered “The Pipeline Crossroads of the World”. It is a benchmark for the Oil market and WTI price is frequently quoted in the media.

Like all assets, supply and demand are the key drivers of WTI Oil price. As such, global growth can be a driver of increased demand and vice versa for weak global growth. Political instability, wars, and sanctions can disrupt supply and impact prices. The decisions of OPEC, a group of major Oil-producing countries, is another key driver of price. The value of the US Dollar influences the price of WTI Crude Oil, since Oil is predominantly traded in US Dollars, thus a weaker US Dollar can make Oil more affordable and vice versa.

The weekly Oil inventory reports published by the American Petroleum Institute (API) and the Energy Information Agency (EIA) impact the price of WTI Oil. Changes in inventories reflect fluctuating supply and demand. If the data shows a drop in inventories it can indicate increased demand, pushing up Oil price. Higher inventories can reflect increased supply, pushing down prices. API’s report is published every Tuesday and EIA’s the day after. Their results are usually similar, falling within 1% of each other 75% of the time. The EIA data is considered more reliable, since it is a government agency.

OPEC (Organization of the Petroleum Exporting Countries) is a group of 12 Oil-producing nations who collectively decide production quotas for member countries at twice-yearly meetings. Their decisions often impact WTI Oil prices. When OPEC decides to lower quotas, it can tighten supply, pushing up Oil prices. When OPEC increases production, it has the opposite effect. OPEC+ refers to an expanded group that includes ten extra non-OPEC members, the most notable of which is Russia.

By |2025-02-10T06:24:43+05:30February 10, 2025 6:24 am|Crude Oil|Comments Off on WTI extends downside below $70.50 as US-China trade war intensifies

EUR/USD hobbles into another NFP Friday

  • EUR/USD remains stuck near the 1.0400 handle heading into Friday.
  • European Retail Sales failed to kickstart Fiber trading.
  • US NFP jobs data remains the key focus for the trading week.

EUR/USD churned some chart paper on Thursday, testing to the low side but wrapped up the day remaining stubbornly stuck near the 1.0400 handle. Euro bidders were entirely uninspired by Pan-EU Retail Sales figures that came in exactly as expected. Greenback traders treaded water ahead of Friday’s fresh print of US Nonfarm Payrolls (NFP) figures.

European Retail Sales growth came in at 1.9% YoY in December, matching median market forecasts and gaining slight ground over the revised previous figure of 1.6%. Despite the upswing in annualized figures, MoM Retail Sales actually contracted, printing at -0.2% compared to the previous month’s flat print of 0.0%, which was also revised slightly lower.

Economic data from the US was primarily mid-tier on Thursday, with weekly Initial Jobless Claims rising to 219K for the week ending January 31. Analysts had anticipated a figure of 213K, while the prior week’s number was slightly adjusted to 208K.

A new release of Nonfarm Payrolls (NFP) is set for Friday, with net job additions projected to decrease to 170K for January, compared to December’s figure of 256K. This week will see close scrutiny of revisions to older data. Historically, post-release revisions have tended to show stronger results in 2024, frustrating market participants who hoped to see weaknesses in the US job market that might encourage the Federal Reserve (Fed) to enact further rate cuts.

EUR/USD price forecast

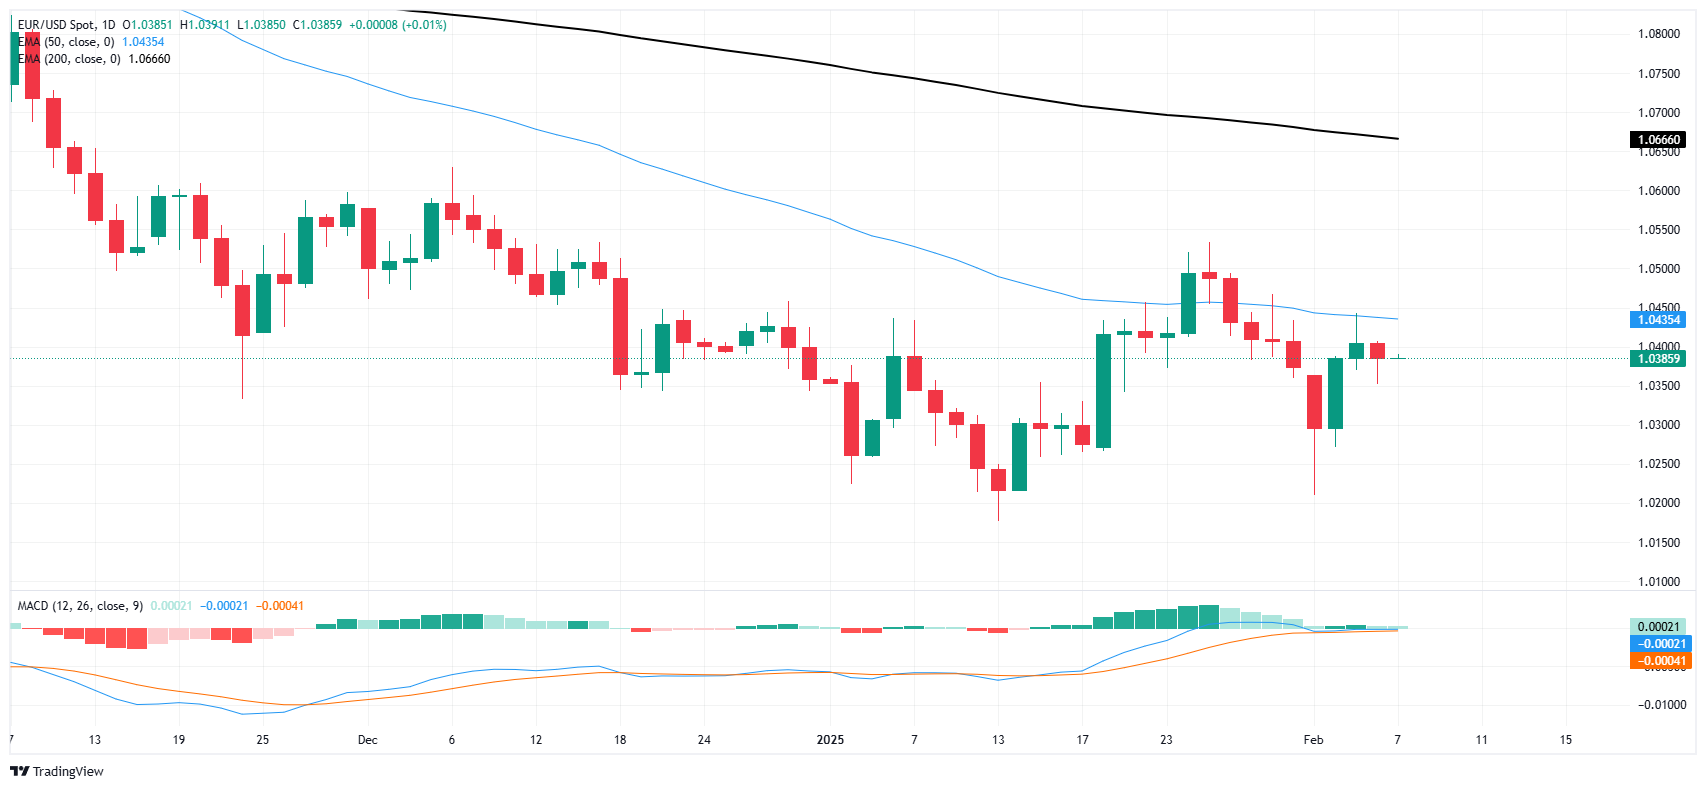
EUR/USD saw some volatility on Thursday during the early hours, but ended the day down a scant 0.2% as price action remains stuck to the 1.0400 handle. Bids remain capped by the 50-day Exponential Moving Average (EMA) near 1.0440. Fiber managed to eke out a bullish recovery after the early week’s plunge toward the 1.0200 handle, but topside momentum remains limited.

EUR/USD daily chart

By |2025-02-10T06:23:17+05:30February 10, 2025 6:23 am|Forex|Comments Off on EUR/USD hobbles into another NFP Friday

NZD/USD gains traction above 0.5650 ahead of US NFP release

  • NZD/USD trades in positive territory around 0.5680 in Friday’s Asian session. 
  • The employment report keeps the RBNZ on track to cut by 50 bps in February. 
  • Fed officials said uncertainty creates the environment for the Fed to slow the pace of cuts.

The NZD/USD pair trades firmer near 0.5680 during the Asian trading hours on Friday. However, the upside for the pair might be limited ahead of the highly anticipated US Nonfarm Payrolls (NFP) data for January, which is due later on Friday.

China filed a World Trade Organization challenge on Wednesday against US President Donald Trump’s new 10% tax on Chinese imports and withdrawal of a duty-free exemption for low-value packages, citing “protectionist” acts that violate WTO regulations. Investors will closely monitor the development surrounding renewed trade war tensions between the US and China, the world’s two largest economies. Any signs of escalation could weigh on the China-proxy Kiwi, as China is a major trading partner to New Zealand.

The New Zealand employment data for the fourth quarter (Q4) will keep the Reserve Bank of New Zealand (RBNZ) on track to cut the Official Cash Rate (OCR) this month. This, in turn, might further weigh on the New Zealand Dollar (NZD). The markets are now pricing in nearly 92% odds that the RBNZ will deliver a 50 basis points (bps) rate cut to 3.75% on February 19. It would be the third consecutive jumbo cut.

The hawkish stance from the Federal Reserve (Fed) officials might provide some support to the Greenback. Chicago Fed President Austan Goolsbee noted on Thursday that the uncertainty makes the environment for the Fed foggier, a reason to slow the pace of cuts. Meanwhile, Fed Vice Chairman Philip Jefferson said late Tuesday that they were facing uncertainty around Trump’s policies, adding that the robust economy would allow them to adopt a cautious approach to further policy-easing.

New Zealand Dollar FAQs

The New Zealand Dollar (NZD), also known as the Kiwi, is a well-known traded currency among investors. Its value is broadly determined by the health of the New Zealand economy and the country’s central bank policy. Still, there are some unique particularities that also can make NZD move. The performance of the Chinese economy tends to move the Kiwi because China is New Zealand’s biggest trading partner. Bad news for the Chinese economy likely means less New Zealand exports to the country, hitting the economy and thus its currency. Another factor moving NZD is dairy prices as the dairy industry is New Zealand’s main export. High dairy prices boost export income, contributing positively to the economy and thus to the NZD.

The Reserve Bank of New Zealand (RBNZ) aims to achieve and maintain an inflation rate between 1% and 3% over the medium term, with a focus to keep it near the 2% mid-point. To this end, the bank sets an appropriate level of interest rates. When inflation is too high, the RBNZ will increase interest rates to cool the economy, but the move will also make bond yields higher, increasing investors’ appeal to invest in the country and thus boosting NZD. On the contrary, lower interest rates tend to weaken NZD. The so-called rate differential, or how rates in New Zealand are or are expected to be compared to the ones set by the US Federal Reserve, can also play a key role in moving the NZD/USD pair.

Macroeconomic data releases in New Zealand are key to assess the state of the economy and can impact the New Zealand Dollar’s (NZD) valuation. A strong economy, based on high economic growth, low unemployment and high confidence is good for NZD. High economic growth attracts foreign investment and may encourage the Reserve Bank of New Zealand to increase interest rates, if this economic strength comes together with elevated inflation. Conversely, if economic data is weak, NZD is likely to depreciate.

The New Zealand Dollar (NZD) tends to strengthen during risk-on periods, or when investors perceive that broader market risks are low and are optimistic about growth. This tends to lead to a more favorable outlook for commodities and so-called ‘commodity currencies’ such as the Kiwi. Conversely, NZD tends to weaken at times of market turbulence or economic uncertainty as investors tend to sell higher-risk assets and flee to the more-stable safe havens.

By |2025-02-10T06:21:43+05:30February 10, 2025 6:21 am|Forex|Comments Off on NZD/USD gains traction above 0.5650 ahead of US NFP release

Australian Dollar moves little as traders adopt caution ahead of US labor data

  • The Australian Dollar could depreciate due to market caution ahead of US Nonfarm Payrolls release on Thursday.
  • The AUD receives downward pressure from increased risk aversion amid the US-China trade situation.
  • US Initial Jobless Claims rose to 219K the previous week, against the expected 213K and 208K prior.

The Australian Dollar (AUD) remains weak against the US Dollar (USD) for the second consecutive day on Friday. The AUD/USD pair faces additional downward pressure due to risk-off sentiment fueled by escalating US-China trade tensions.

China, Australia’s key trading partner, retaliated against the new 10% US tariff that took effect on Tuesday. However, on Monday afternoon, US President Donald Trump stated that he would likely speak with China within 24 hours. Trump also warned, “If we can’t reach a deal with China, the tariffs will be very, very substantial.” Despite this, no further updates have emerged.

Markets now price a 95% probability of a Reserve Bank of Australia (RBA) rate cut from 4.35% to 4.10% in February, further weakening the AUD’s resilience. The RBA has kept the Official Cash Rate (OCR) at 4.35% since November 2023, emphasizing that inflation must “sustainably” return to its 2%-3% target range before considering any policy easing.

Australian Dollar could decline amid market caution ahead of US jobs report

  • The US Dollar Index (DXY), which measures the US Dollar’s value against six major currencies, rises to near 107.70 at the time of writing. The Greenback could receive support as sentiment turns cautious ahead of a key US jobs report. Traders brace for Friday’s US Nonfarm Payrolls (NFP) data, which is expected to shape the Federal Reserve’s (Fed) monetary policy direction.
  • US Initial Jobless Claims rose to 219K for the week ending January 31, as reported by the US Department of Labor (DoL) on Thursday. This print surpasses initial estimates of 213K and was higher than the previous week’s revised tally of 208K (from 207K).
  • The US ISM Services PMI eased to 52.8 in January from 54.0 (revised from 54.1) in December. This reading came in below the market consensus of 54.3.
  • Federal Reserve Bank of Dallas President Lorie Logan made headlines late Thursday, stating that while inflation progress has been significant, the US labor market remains too strong for the Fed to consider rate cuts in the near future. Logan also acknowledged that even if inflation reaches the 2% target, it may not be sufficient on its own to prompt a rate reduction.
  • On Thursday, Federal Reserve Vice Chair Philip Jefferson expressed his satisfaction with keeping the Fed Funds rate at its current level, stating that he would assess the overall impact of Trump’s policies before making further decisions. He also emphasized that the Fed’s rate remains restrictive for the economy, even with a 100-basis-point decline.
  • President Trump has agreed to a 30-day suspension of the proposed 25% tariffs on Canadian and Mexican imports. This decision comes after Canadian Prime Minister Justin Trudeau and Mexican President Claudia Sheinbaum committed to enhancing border security measures to address concerns over illegal immigration and drug trafficking.
  • China’s Commerce Ministry announced that it will impose a 15% tariff on US coal and liquefied natural gas (LNG) imports, along with an additional 10% tariff on crude Oil, farm equipment, and certain automobiles. Additionally, to “safeguard national security interests,” China is implementing export controls on tungsten, tellurium, ruthenium, molybdenum, and related products.
  • Australia’s trade surplus fell to 5,085M in December, missing the expected 7,000M and down from the previous surplus of 6,792M. Exports increased by 1.1% MoM, slowing from November’s 4.2% rise, while imports surged 5.9% MoM, up from 1.4% in the prior month.
  • Australia’s Judo Bank Composite PMI climbed to 51.1 in January from 50.2 in December, reflecting modest growth in private sector activity. Meanwhile, the Judo Bank Services PMI rose to 51.2 from 50.8, marking the twelfth consecutive month of expansion in the services sector. Although growth was moderate, it was the strongest since August.

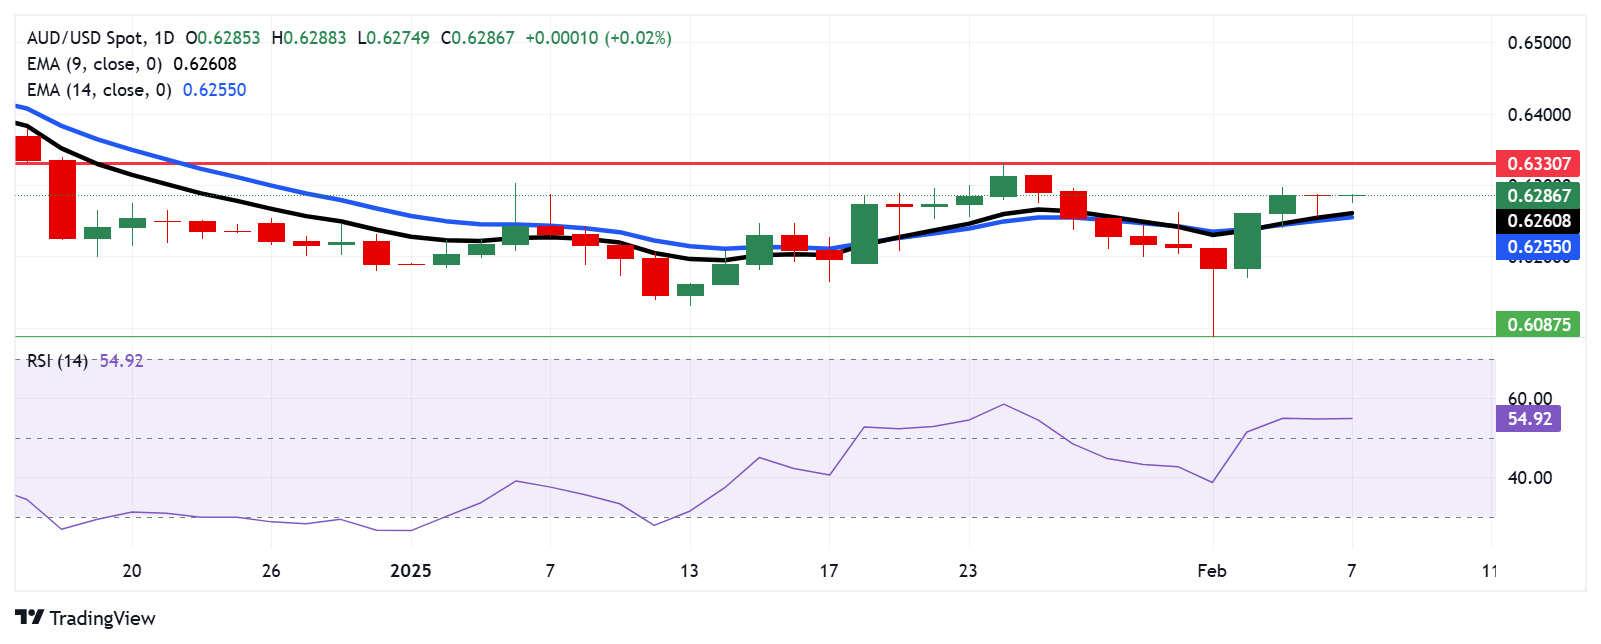
Australian Dollar remains steady below 0.6300, initial support appears at nine-day EMA

AUD/USD hovers near 0.6290 on Friday, maintaining position above the nine- and 14-day Exponential Moving Averages (EMAs) on the daily chart, signaling stronger short-term bullish momentum. Additionally, the 14-day Relative Strength Index (RSI) remains above the 50 level, reinforcing the bullish trend.

On the upside, the AUD/USD pair could test the seven-week high of 0.6330, last reached on January 24.

Immediate support lies at the nine-day EMA near 0.6260, followed by the 14-day EMA at 0.6254. A break below these levels could weaken the bullish outlook, potentially driving the AUD/USD pair toward 0.6087—the lowest level since April 2020, recorded on February 3.

AUD/USD: Daily Chart
By |2025-02-10T06:19:02+05:30February 10, 2025 6:19 am|Forex|Comments Off on Australian Dollar moves little as traders adopt caution ahead of US labor data

USD/INR holds steady as traders brace for RBI rate decision

  • The Indian Rupee flatlines in Friday’s Asian session. 
  • Rising RBI rate cut bets, weakness of Asian peers and uncertainties could undermine the INR. 
  • RBI’s interest rate decision will be closely watched on Friday. 

The Indian Rupee (INR) holds steady after falling to a fresh all-time low in the previous session. The local currency remains vulnerable amid expectations of a rate cut by the Reserve Bank of India (RBI). Furthermore, a broader decline among Asian currencies, the uncertainties surrounding US trade tariffs and continued portfolio outflows might undermine the INR.

Nonetheless, the routine intervention by the RBI to sell US Dollar via state-run banks might help limit the INR’s losses. The RBI interest rate decision on Friday will be in the spotlight. Investors will also scrutinize the statement from the new RBI Governor Sanjay Malhotra to assess the direction of the central bank’s monetary policy. The attention will shift to the US labour market data later in the day, including Nonfarm Payrolls (NFP), Unemployment Rate and Average Hourly Earnings.

Indian Rupee steadies ahead of RBI rate decision

  • The RBI is expected to cut the interest rate by 25 basis points (bps) to 6.25% at the policy meeting concluding on Friday, in what would be its first rate cut in nearly five years.
  • “The delay in implementation of universal tariffs by the incoming U.S. administration provides some tactical space for RBI to prioritize domestic growth… and space to cut policy rates,” said Ruhul Bajoria, an economist at Bank of America in India.
  • Most of the economists surveyed by Bloomberg anticipate that the Indian central bank will lower the benchmark repurchase rate by at least 25 basis points (bps) to 6.25% on Friday.
  • Chicago Fed President Austan Goolsbee noted on Thursday that the uncertainty makes the environment for the Fed foggier, a reason to slow the pace of cuts.
  • Dallas Fed President Lorie Logan said that while inflation progress has been significant, the US labor market remains far too firm to push the Fed into rate cuts any time soon.

USD/INR paints a positive picture, overbought RSI warrants caution for bulls in the short term

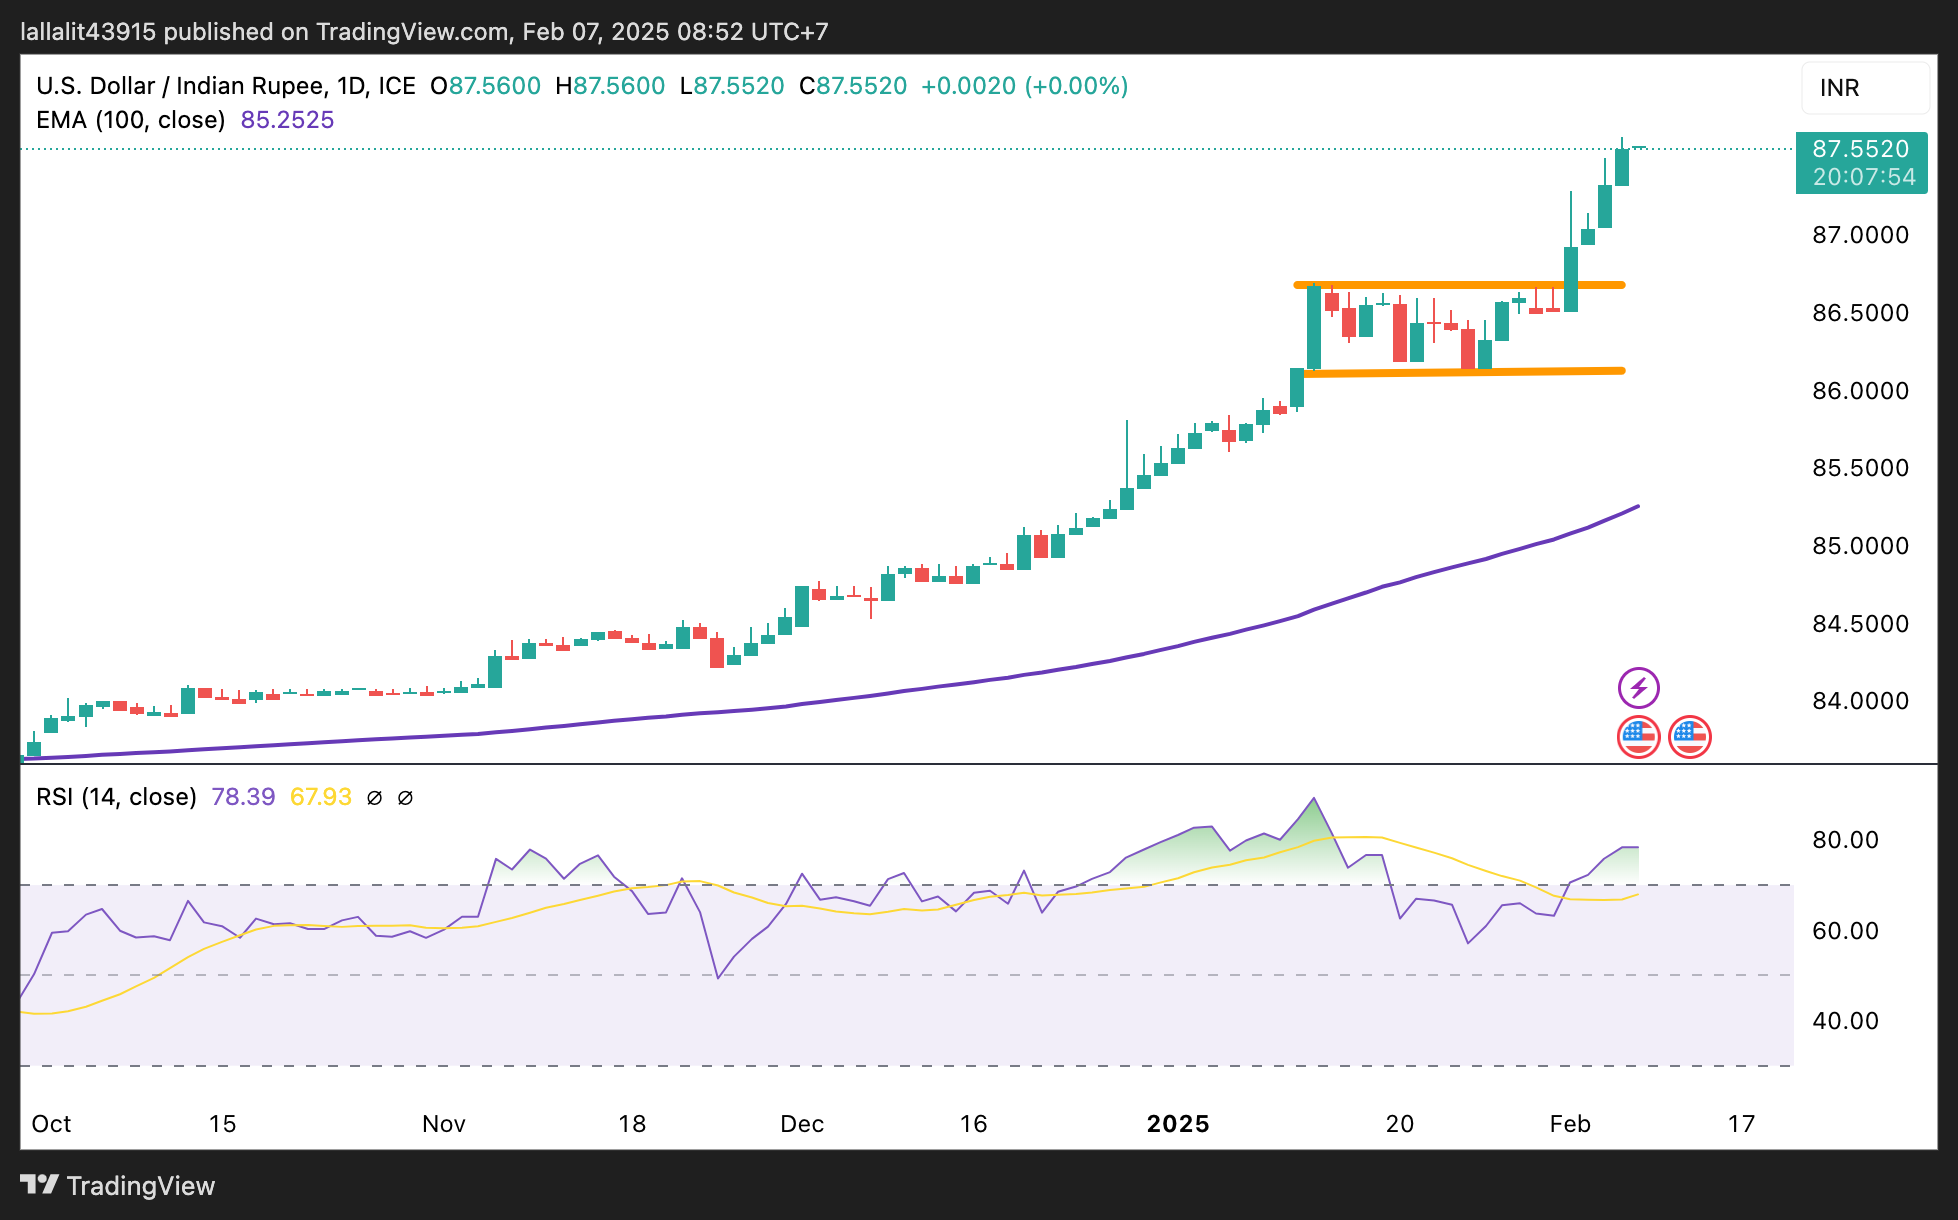
The Indian Rupee trades on a flat note on the day. The constructive outlook of the USD/INR pair remains intact as the price holds above the key 100-day Exponential Moving Average (EMA) on the daily chart. However, the 14-day Relative Strength Index (RSI) reaches overbought territory beyond the 70.00 mark, potentially signaling a temporary weakness or further consolidation in the near term.

The immediate resistance level for USD/INR emerges at 87.62, an all-time high. Sustained trading above this level could pave the way to the 88.00 psychological level.

On the downside, the initial support level for the pair is located in the 87.05-87.00 zone, representing the low of February 5 and the round mark. A breach of the mentioned level could drag USD/INR down to 86.51, the low of February 3.

By |2025-02-10T06:17:18+05:30February 10, 2025 6:17 am|Forex|Comments Off on USD/INR holds steady as traders brace for RBI rate decision

Silver Price Forecast: XAG/USD remains steady near $32.50, close to three-month highs

  • Silver price holds ground near its three-month high of $32.56, recorded on February 5.
  • The upside of the Silver appears limited as the US Dollar gains ground amid rebounding US Treasury yields.
  • Traders await US Nonfarm Payrolls to gain fresh impetus regarding the Fed’s monetary policy direction.

Silver price (XAG/USD) remains in positive territory for the fifth consecutive session, trading around $32.30 per troy ounce during Asian hours on Friday. The precious metal maintains its position near its three-month high of $32.56, recorded on February 5. Traders are awaiting key US labor market data, including Nonfarm Payrolls (NFP), which could influence the Federal Reserve’s (Fed) monetary policy direction.

However, Silver’s upside appears limited as the US Dollar (USD) extends its recovery amid rebounding US Treasury yields. The US Dollar Index (DXY), which tracks the USD against six major currencies, has climbed near 107.70, while 2-year and 10-year US Treasury yields stand at 4.22% and 4.43%, respectively, at the time of writing.

Safe-haven metals like Silver have gained ground amid heightened risk aversion due to global trade and economic uncertainties. However, trade negotiations between the United States (US) and China could temper this sentiment. US President Donald Trump and Chinese President Xi Jinping are set to discuss potential tariff rollbacks, which could ease market concerns and limit Silver’s upside.

Diminished fears of a US-China trade war also reduce the risk of rising US inflation, reinforcing expectations of two Federal Reserve rate cuts this year. As a non-yielding asset, Silver benefits from a dovish stance by major central banks.

Meanwhile, the Reserve Bank of India (RBI) is expected to announce a 25-basis-point rate cut on Friday. Last week, the European Central Bank (ECB) lowered its Deposit Facility Rate by 25 basis points to 2.75%, while the People’s Bank of China (PBoC) has signaled potential rate cuts. Additionally, the Bank of Canada (BoC) has paused its quantitative tightening, and Sweden’s Riksbank has cut interest rates.

Silver FAQs

Silver is a precious metal highly traded among investors. It has been historically used as a store of value and a medium of exchange. Although less popular than Gold, traders may turn to Silver to diversify their investment portfolio, for its intrinsic value or as a potential hedge during high-inflation periods. Investors can buy physical Silver, in coins or in bars, or trade it through vehicles such as Exchange Traded Funds, which track its price on international markets.

Silver prices can move due to a wide range of factors. Geopolitical instability or fears of a deep recession can make Silver price escalate due to its safe-haven status, although to a lesser extent than Gold’s. As a yieldless asset, Silver tends to rise with lower interest rates. Its moves also depend on how the US Dollar (USD) behaves as the asset is priced in dollars (XAG/USD). A strong Dollar tends to keep the price of Silver at bay, whereas a weaker Dollar is likely to propel prices up. Other factors such as investment demand, mining supply – Silver is much more abundant than Gold – and recycling rates can also affect prices.

Silver is widely used in industry, particularly in sectors such as electronics or solar energy, as it has one of the highest electric conductivity of all metals – more than Copper and Gold. A surge in demand can increase prices, while a decline tends to lower them. Dynamics in the US, Chinese and Indian economies can also contribute to price swings: for the US and particularly China, their big industrial sectors use Silver in various processes; in India, consumers’ demand for the precious metal for jewellery also plays a key role in setting prices.

Silver prices tend to follow Gold’s moves. When Gold prices rise, Silver typically follows suit, as their status as safe-haven assets is similar. The Gold/Silver ratio, which shows the number of ounces of Silver needed to equal the value of one ounce of Gold, may help to determine the relative valuation between both metals. Some investors may consider a high ratio as an indicator that Silver is undervalued, or Gold is overvalued. On the contrary, a low ratio might suggest that Gold is undervalued relative to Silver.

By |2025-02-10T06:16:08+05:30February 10, 2025 6:16 am|Gold Silver|Comments Off on Silver Price Forecast: XAG/USD remains steady near $32.50, close to three-month highs

USD/CAD Price Forecast: Consolidates above 1.4300, lower threshold of rectangle

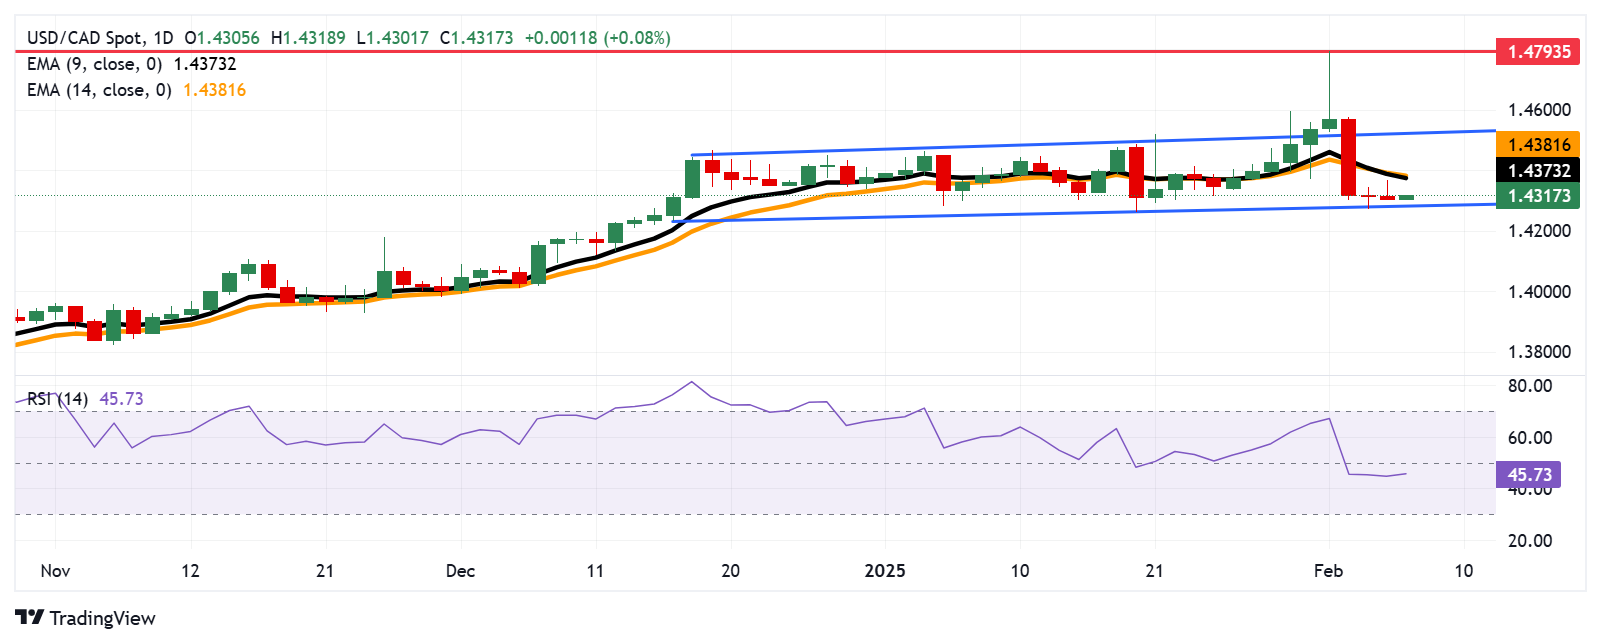
  • USD/CAD may test the lower boundary of the rectangle at 1.4280 level.
  • The short-term price momentum is weaker as the pair remains below the nine- and 14-day EMAs.
  • A break above EMAs would support the pair to test the rectangle’s upper threshold at 1.4530 level.

The USD/CAD pair remains silent around 1.4310 during the Asian session on Friday. The technical analysis of the daily chart indicates that buyers and sellers are unsure of the long-term direction of the asset as the pair consolidates within a rectangular pattern.

USD/CAD remains below the nine- and 14-day Exponential Moving Averages (EMAs), reinforcing bearish sentiment and suggesting weak short-term price action. This positioning reflects sustained selling interest and hints at further downside risks.

Additionally, the 14-day Relative Strength Index (RSI) consolidates below the 50 mark, signaling continued negative momentum and strengthening the bearish outlook.

On the downside, immediate support is found at a psychological level of 1.4300, followed by the lower threshold of the rectangle at 1.4280 level. A break below this critical support zone could strengthen the bearish bias and put downward pressure on the USD/CAD pair to navigate the region around the psychological level of 1.4200.

The USD/CAD pair could find its initial resistance at the nine-day EMA at 1.4372 level, followed by the 14-day EMA at 1.4381 level. A break above these levels would improve the short-term price momentum and support the pair to test the rectangle’s upper threshold at the 1.4530 level.

USD/CAD: Daily Chart

By |2025-02-10T06:14:56+05:30February 10, 2025 6:14 am|Forex|Comments Off on USD/CAD Price Forecast: Consolidates above 1.4300, lower threshold of rectangle

GBP/USD trades with negative bias around 1.2425 area, US NFP report awaited

  • GBP/USD remains depressed for the second straight day amid the BoE’s dovish outlook.
  • The BoE cut interest rates by 25 bps on Thursday and signaled further rate cuts this year. 
  • Subdued USD price action helps limit the downside ahead of the crucial US NFP report.

The GBP/USD pair struggles to capitalize on the overnight bounce from a multi-day low and trades with a mild negative bias, around the 1.2425 area during the Asian session on Friday. This marks the second straight day of a downtick, though it lacks follow-through as traders seem reluctant to place aggressive bets and opt to wait for the release of the US monthly jobs data.

The popularly known Nonfarm Payrolls (NFP) report is expected to show that the world’s largest economy added 170K jobs in December, down from 256K in the previous month. Meanwhile, the Unemployment Rate is expected to hold steady at 4.1%. This, along with Average Weekly Earnings, will play a key role in influencing the near-term US Dollar (USD) price dynamics and provide some meaningful impetus to the GBP/USD pair.

Heading into the key data risk, expectations that the Federal Reserve (Fed) will stick to its easing bias and lower borrowing costs twice by the end of this year keep the US Treasury bond yields depressed near their lowest level since December. This, in turn, fails to assist the USD to attract any meaningful buyers and might act as a tailwind for the GBP/USD pair, though the Bank of England’s (BoE) gloomy outlook should cap the upside.

In fact, the UK central bank lowered its benchmark interest rate by 25 basis points on Thursday and downgraded the growth forecast for 2025. Adding to this, BoE Governor Andrew Bailey told reporters that the central bank expects to make further rate cuts this year. This might continue to undermine the British Pound (GBP) and suggests that the path of least resistance for the GBP/USD pair remains to the downside.

Pound Sterling FAQs

The Pound Sterling (GBP) is the oldest currency in the world (886 AD) and the official currency of the United Kingdom. It is the fourth most traded unit for foreign exchange (FX) in the world, accounting for 12% of all transactions, averaging $630 billion a day, according to 2022 data. Its key trading pairs are GBP/USD, also known as ‘Cable’, which accounts for 11% of FX, GBP/JPY, or the ‘Dragon’ as it is known by traders (3%), and EUR/GBP (2%). The Pound Sterling is issued by the Bank of England (BoE).

The single most important factor influencing the value of the Pound Sterling is monetary policy decided by the Bank of England. The BoE bases its decisions on whether it has achieved its primary goal of “price stability” – a steady inflation rate of around 2%. Its primary tool for achieving this is the adjustment of interest rates. When inflation is too high, the BoE will try to rein it in by raising interest rates, making it more expensive for people and businesses to access credit. This is generally positive for GBP, as higher interest rates make the UK a more attractive place for global investors to park their money. When inflation falls too low it is a sign economic growth is slowing. In this scenario, the BoE will consider lowering interest rates to cheapen credit so businesses will borrow more to invest in growth-generating projects.

Data releases gauge the health of the economy and can impact the value of the Pound Sterling. Indicators such as GDP, Manufacturing and Services PMIs, and employment can all influence the direction of the GBP. A strong economy is good for Sterling. Not only does it attract more foreign investment but it may encourage the BoE to put up interest rates, which will directly strengthen GBP. Otherwise, if economic data is weak, the Pound Sterling is likely to fall.

Another significant data release for the Pound Sterling is the Trade Balance. This indicator measures the difference between what a country earns from its exports and what it spends on imports over a given period. If a country produces highly sought-after exports, its currency will benefit purely from the extra demand created from foreign buyers seeking to purchase these goods. Therefore, a positive net Trade Balance strengthens a currency and vice versa for a negative balance.

By |2025-02-10T06:13:40+05:30February 10, 2025 6:13 am|Forex|Comments Off on GBP/USD trades with negative bias around 1.2425 area, US NFP report awaited

India Gold price today: Gold rises, according to FXStreet data

Gold prices rose in India on Friday, according to data compiled by FXStreet.

The price for Gold stood at 8,062.54 Indian Rupees (INR) per gram, up compared with the INR 8,029.32 it cost on Thursday.

The price for Gold increased to INR 94,049.27 per tola from INR 93,652.40 per tola a day earlier.

Unit measure Gold Price in INR
1 Gram 8,062.54
10 Grams 80,633.45
Tola 94,049.27
Troy Ounce 250,773.30


FXStreet calculates Gold prices in India by adapting international prices (USD/INR) to the local currency and measurement units. Prices are updated daily based on the market rates taken at the time of publication. Prices are just for reference and local rates could diverge slightly.

Gold FAQs

Gold has played a key role in human’s history as it has been widely used as a store of value and medium of exchange. Currently, apart from its shine and usage for jewelry, the precious metal is widely seen as a safe-haven asset, meaning that it is considered a good investment during turbulent times. Gold is also widely seen as a hedge against inflation and against depreciating currencies as it doesn’t rely on any specific issuer or government.

Central banks are the biggest Gold holders. In their aim to support their currencies in turbulent times, central banks tend to diversify their reserves and buy Gold to improve the perceived strength of the economy and the currency. High Gold reserves can be a source of trust for a country’s solvency. Central banks added 1,136 tonnes of Gold worth around $70 billion to their reserves in 2022, according to data from the World Gold Council. This is the highest yearly purchase since records began. Central banks from emerging economies such as China, India and Turkey are quickly increasing their Gold reserves.

Gold has an inverse correlation with the US Dollar and US Treasuries, which are both major reserve and safe-haven assets. When the Dollar depreciates, Gold tends to rise, enabling investors and central banks to diversify their assets in turbulent times. Gold is also inversely correlated with risk assets. A rally in the stock market tends to weaken Gold price, while sell-offs in riskier markets tend to favor the precious metal.

The price can move due to a wide range of factors. Geopolitical instability or fears of a deep recession can quickly make Gold price escalate due to its safe-haven status. As a yield-less asset, Gold tends to rise with lower interest rates, while higher cost of money usually weighs down on the yellow metal. Still, most moves depend on how the US Dollar (USD) behaves as the asset is priced in dollars (XAU/USD). A strong Dollar tends to keep the price of Gold controlled, whereas a weaker Dollar is likely to push Gold prices up.

(An automation tool was used in creating this post.)

By |2025-02-10T06:10:49+05:30February 10, 2025 6:10 am|Gold Silver|Comments Off on India Gold price today: Gold rises, according to FXStreet data
Go to Top