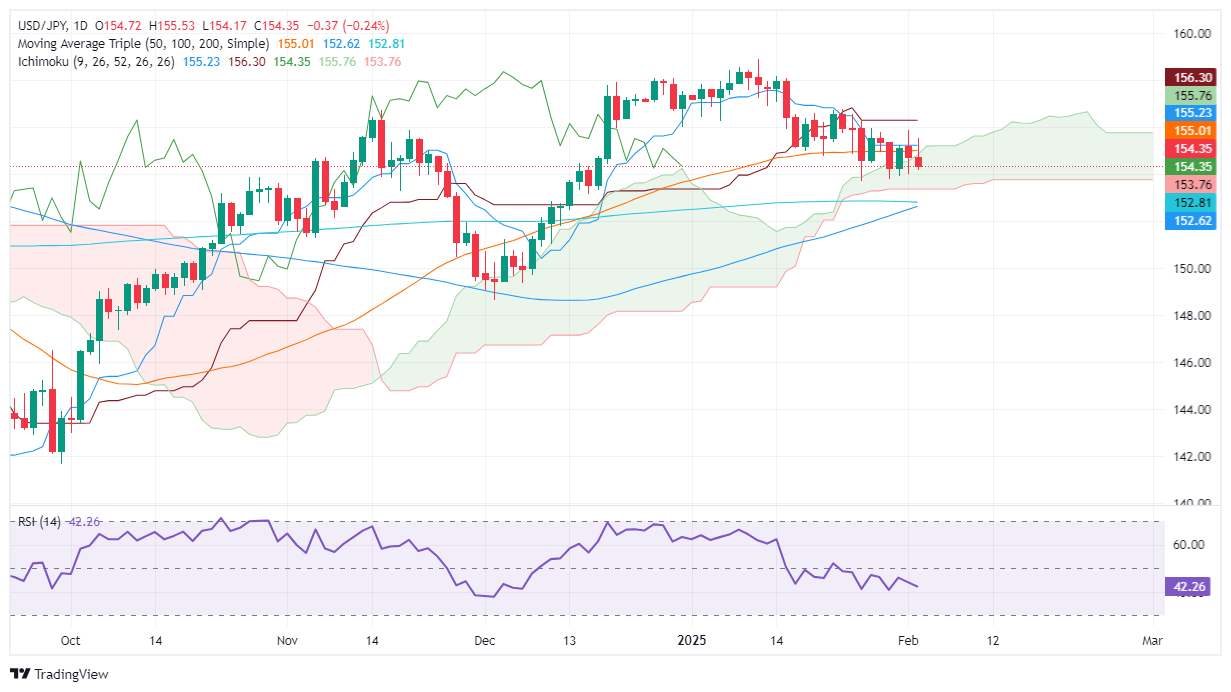
- USD/JPY faces continued pressure, potentially closing below 155.00 as US-China trade war escalates.
- Technical indicators suggest further downside, with pair now trading within the Ichimoku Cloud.
- Resistance and support levels closely watched, with potential rebounds facing hurdles at 155.76 and 156.29.
The USD/JPY drops below 155.00 for the second straight day and seems poised to achieve a daily close below the latter. Falling US Treasury yields and the escalation of the “trade war” between the United States (US) and China would underpin the Japanese Yen (JPY) due to its safe-haven appeal. At the time of writing, the pair posts losses of 0.28%.
USD/JPY Price Analysis: Technical outlook
Developments over the weekend developed a huge 190-pipe candle on February 3, which lately closed below 155.00 for the first time since January 30. Additionally, the USD/JPY pair cleared the 50-day Simple Moving Average (SMA) at 155.02 and registered back-to-back bearish close days, which could pave the way for further downside.
Of note is that the USD/JPY spot price lies inside the Ichimoku Cloud (Kumo), which indicates “sideways price action.”
If USD/JPY edged below the January 30 low of 153.79, this could open the door to challenge the Senkou Span B at 153.76, followed by the January 27 low of 153.71. If those levels are cleared, the next support would be the 200-day SMA at 152.81.
Conversely, if USD/JPY climbs above the 50-day SMA, the next resistance would be the Senkou Span A at 155.76, ahead of challenging the Tenkan-Sen at 156.29


